Chapter 2 Implementation
2.1 CoMutPlotter Framework
CoMutPltter takes mutational profiles from whole-exome sequencing or whole-genome sequencing as input materials.
2.2 Data Input
2.2.1 Supported Input File Formats
Three dominant file formats are supported:
Variant Call Format (VCF)
Mutation Annotation Format (GDC MAF)
Tab Separated Values (ICGC TSV)
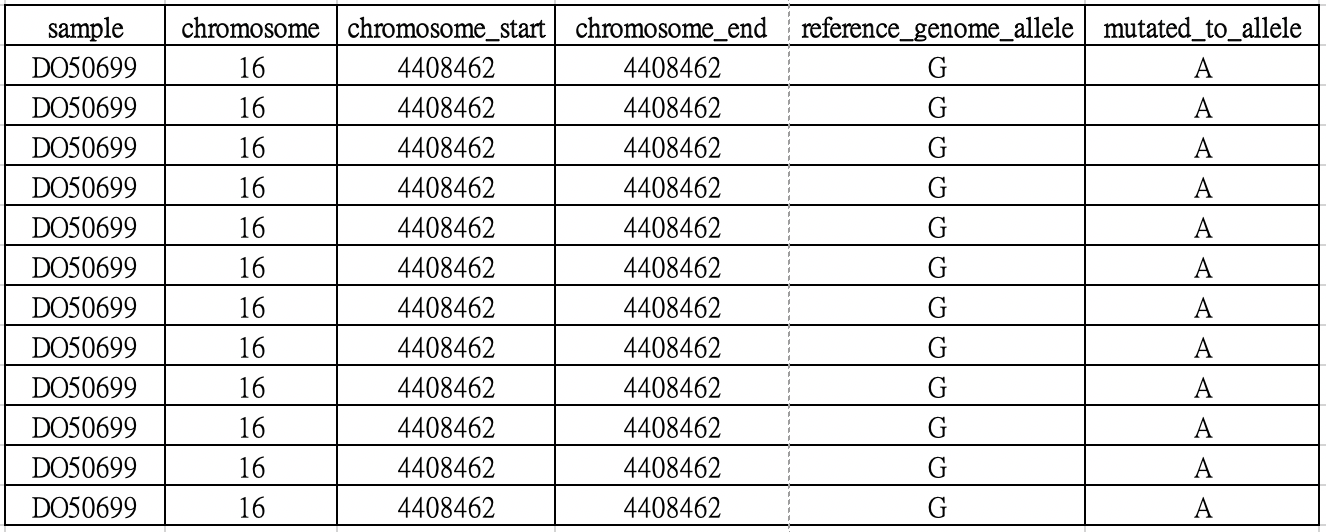
Custom tab-delimited file
The custom tab-delimited file should contain at least 6 columns (sample, chromosome, chromosome_start, chromosome_end, reference_genome_allele and mutated_to_allele).
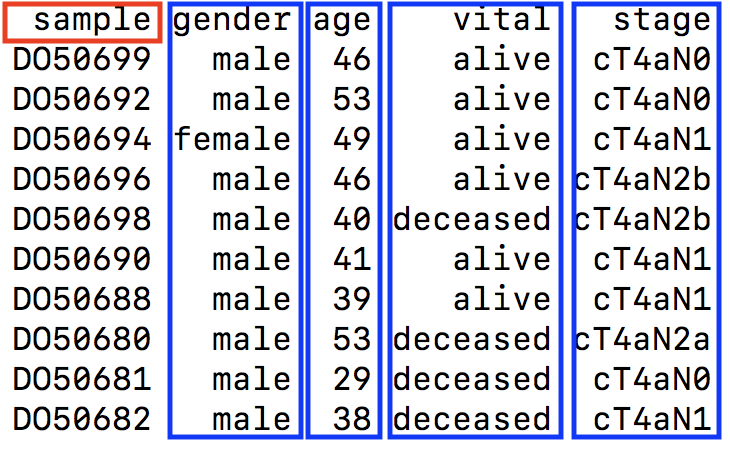
2.2.2 Supported format for sample metadata/clinical information
As shown in the following figure, Tab-delimited format is supported and the sample ID column should be “sample”. Additional phenotypes or clinical features should be rendered as separated columns according to their respective samples.
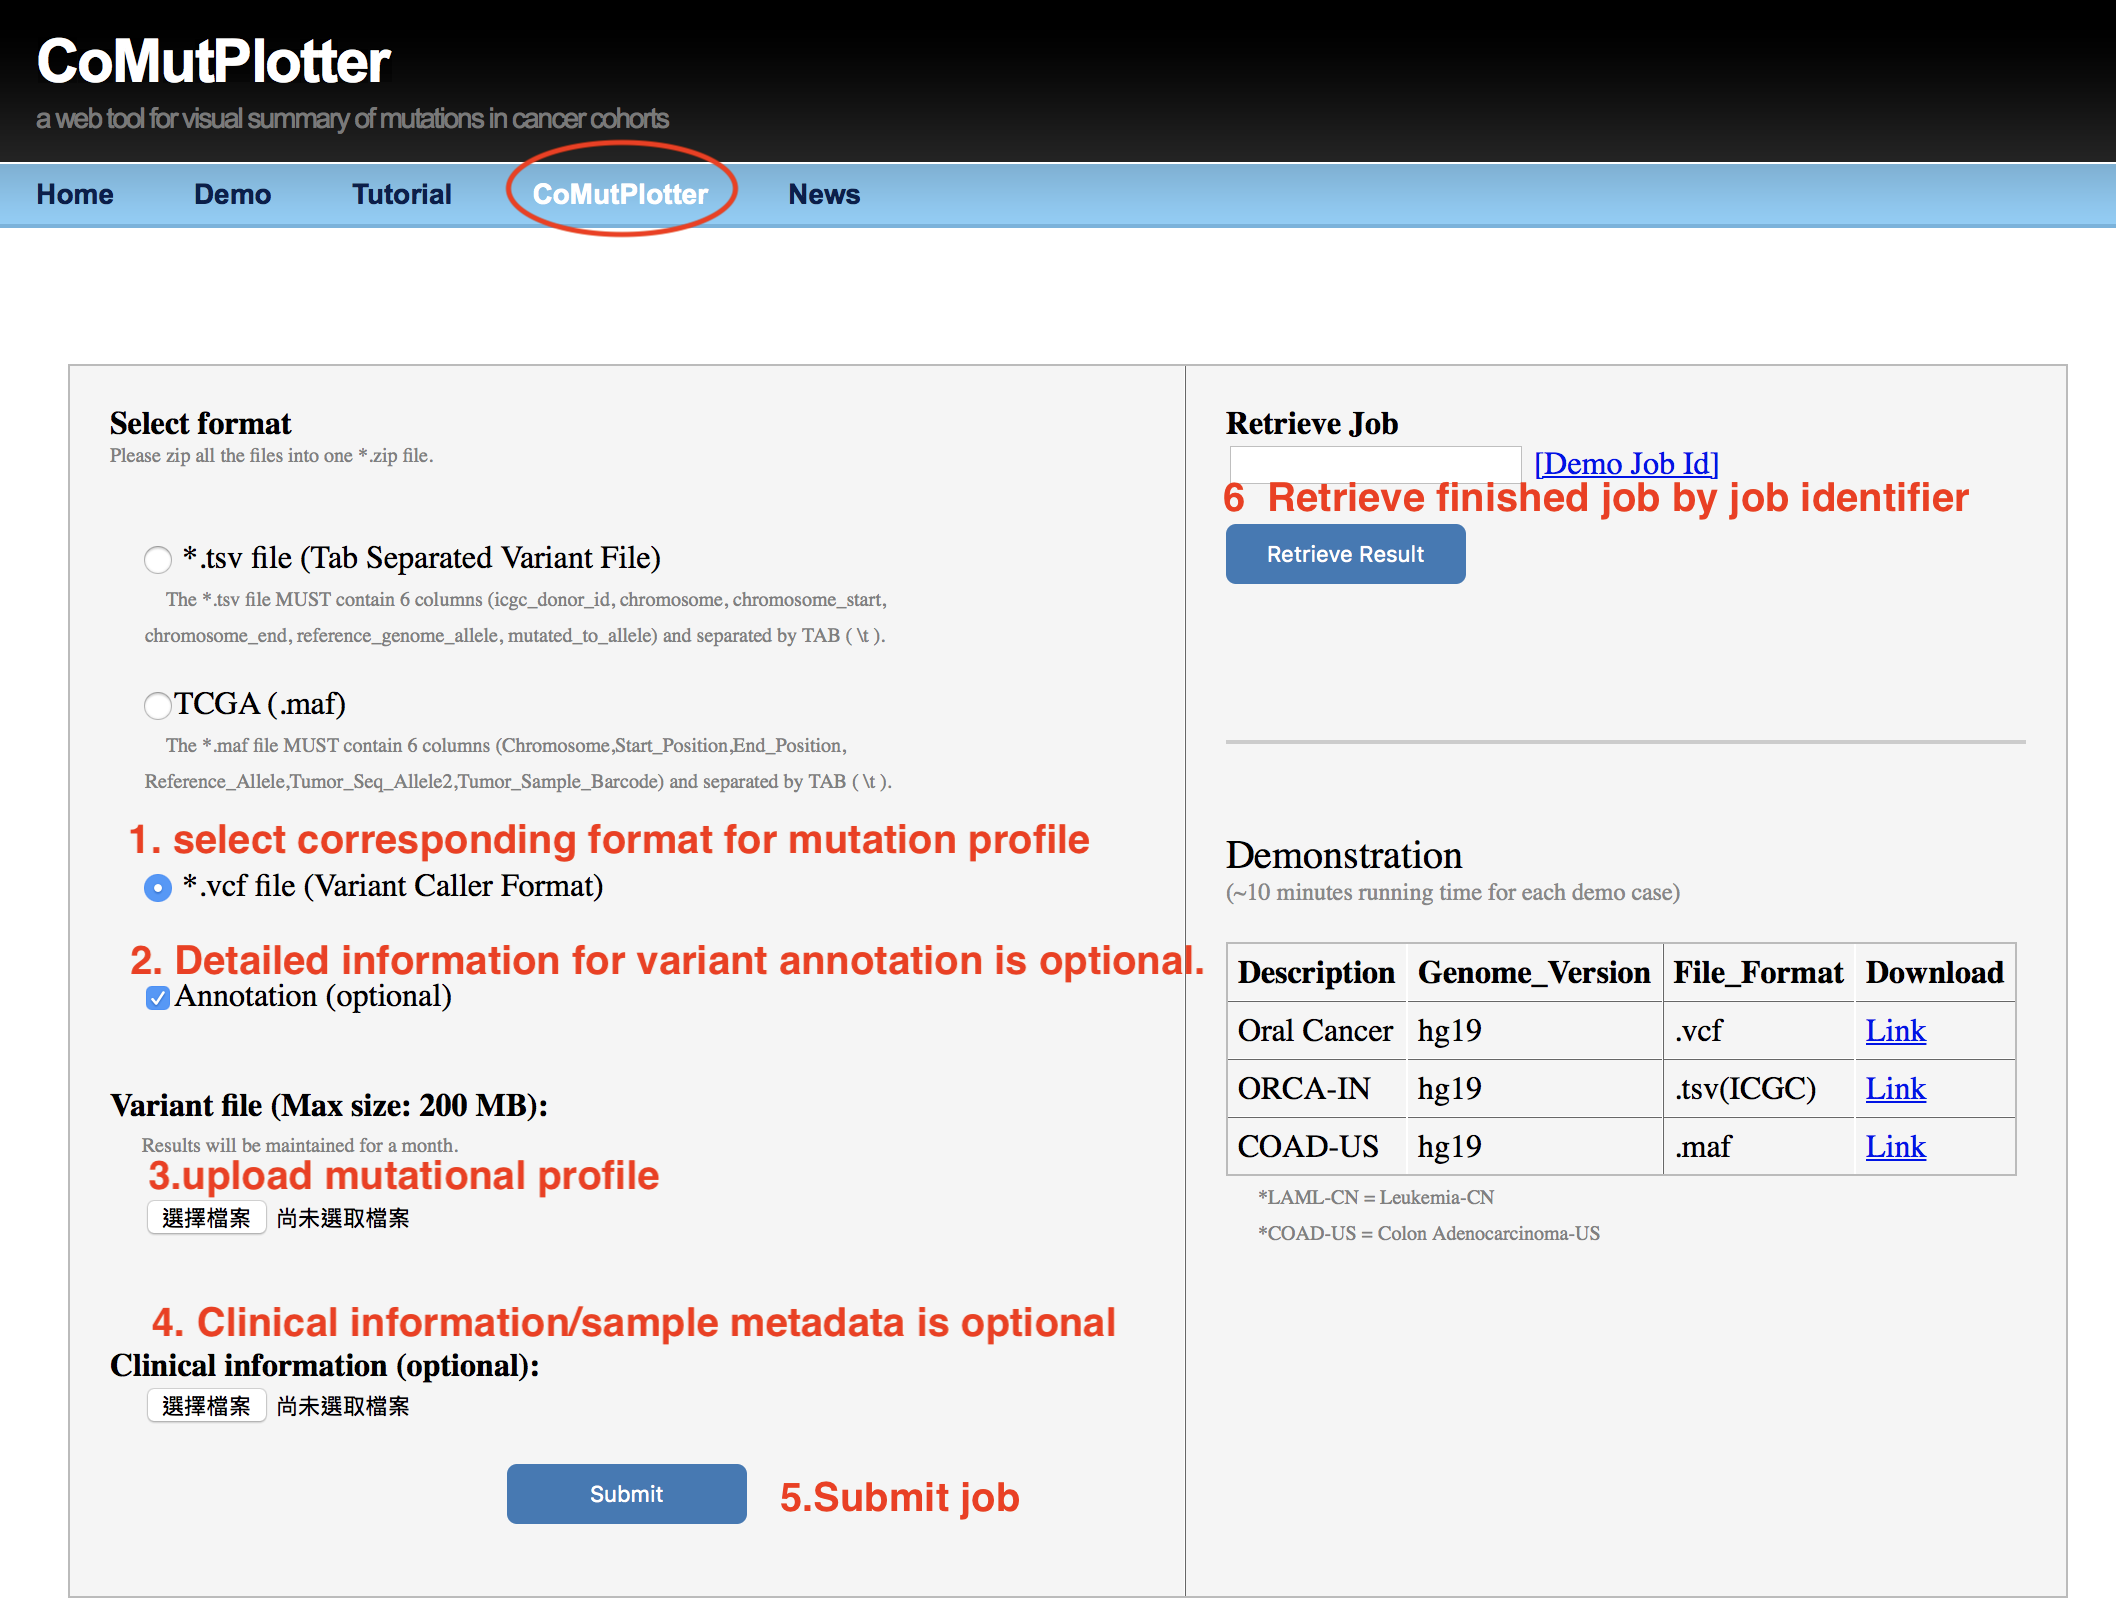
2.2.3 Upload Interface
- Select format for mutation profile
- Detailed information for variant annotation is optional.
- Upload mutation profile
- Clinical information/sample metadata is optional.
- Submit Job
- Retreive finished Job by Job Identifier
2.2.4 For custom study with large number of VCF files
To make data management and analysis more efficient, mutation profiles in diverse formats are converted to MAF format before entering subsequent analyses. A custom script for file format conversion is available for download (https://drive.google.com/file/d/1erLDY6gocUMilhW7KLAzyW1X9rqCKhMC/view ) when users try to deal with a study cohort with large number of VCF files.
Usage: ./vcf2maf.R [-[-DB|d] [<character>]] [-[-out|o] [<character>]] [-[-help|h]]
    -d|--DB      Select annotation DB:hg19 ,hg38 ,default: hg19 (optional)
    -o|--out     output file name, default: custom.maf (optional)
    -h|--help    This help

 Jul. 13, 2018
Please contact Po-Jung Huang at Department of Biomedical Sciences, Chang Gung University.
            (pjhuang@gap.cgu.edu.tw) if you have any question!
The resulting custom.maf can be used for uploading to CoMutPlotter server.
2.2.5 Functional consequence annotation
CoMutPlotter uses Oncotator as its default annotation package to ensure the annotation results are comparble between custom cohort and TCGA/ICGC studies and make variant annotation become a reproducible step.
Oncotator 1.9.9.0 was retrieved from the Docker public repository and installed on our server for functional consequence annotation.
2.2.6 Cancer driver genes identification
MutSigCV version 1.4 was retrieved from the Docker public repository and installed on our server for identifying genes that are significantly mutated in cancer genomes, using a model with mutational covariates.
The prepareMutSig function of Maftools was used to correct the discrepancy between Hugo_Symbols in MAF and non-Hugo symbols in the covariates files provided by MutSigCV package.
2.2.7 Mutational signature Identification
Up to date, 30 distinct mutational signatures have been identified and categorized in COSMIC database using the WTSI Mutational Signature Analysis Framework. Quantifying known signatures in individual samples is not possible under the current WTSI framework when sample sizes are small. The deconstructSigs R package was adopted to address the issue and to perform the identification and quantification of mutational signatures within a single tumor sample.
2.3 Visualization and web modules
The bar plot is used to represent the mutation rate of each sample and heatmaps are used to display the mutation types, signifiant values of cancer driver genes, and sample information.
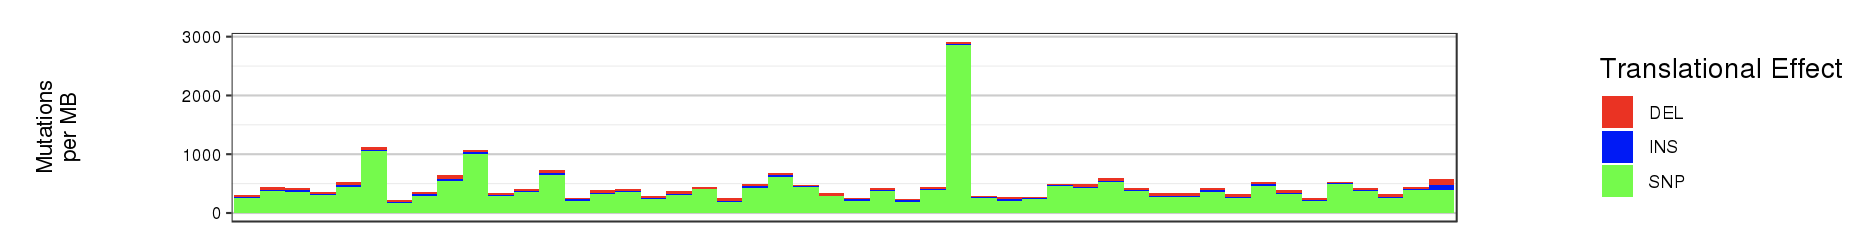
- Bar plot
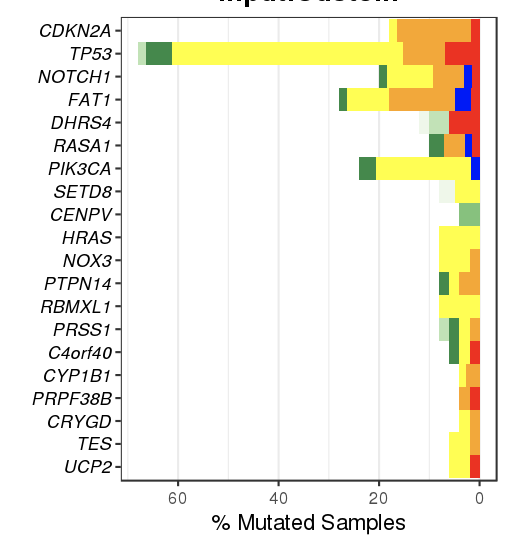
- Heatmaps
Heapmaps are used to represent the gene mutation types, clinical information and inde
The stacked bar and dot matrix function of ggplot2 are used to display the contributions of mutational signatures in individual samples.
- The gtable R package is used to render the CoMut Plot.
- The Shiny R package is used to construct the framework of CoMutPlotter.
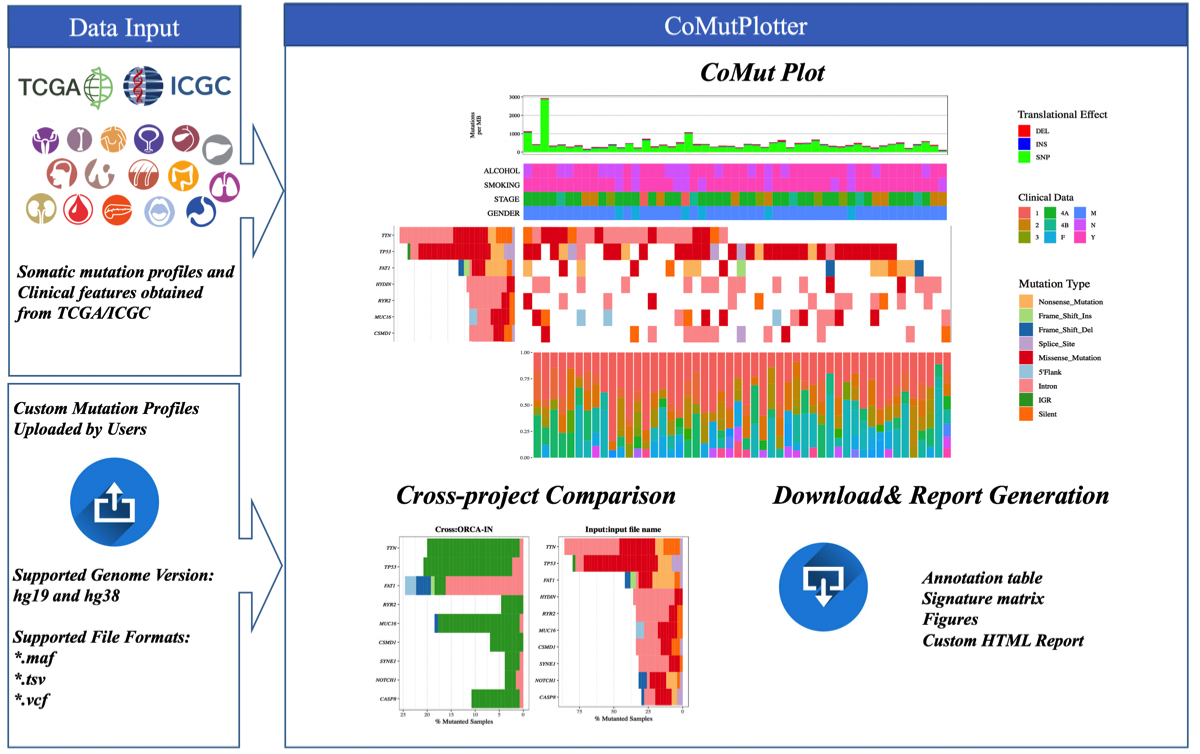
2.4 OUTPUT
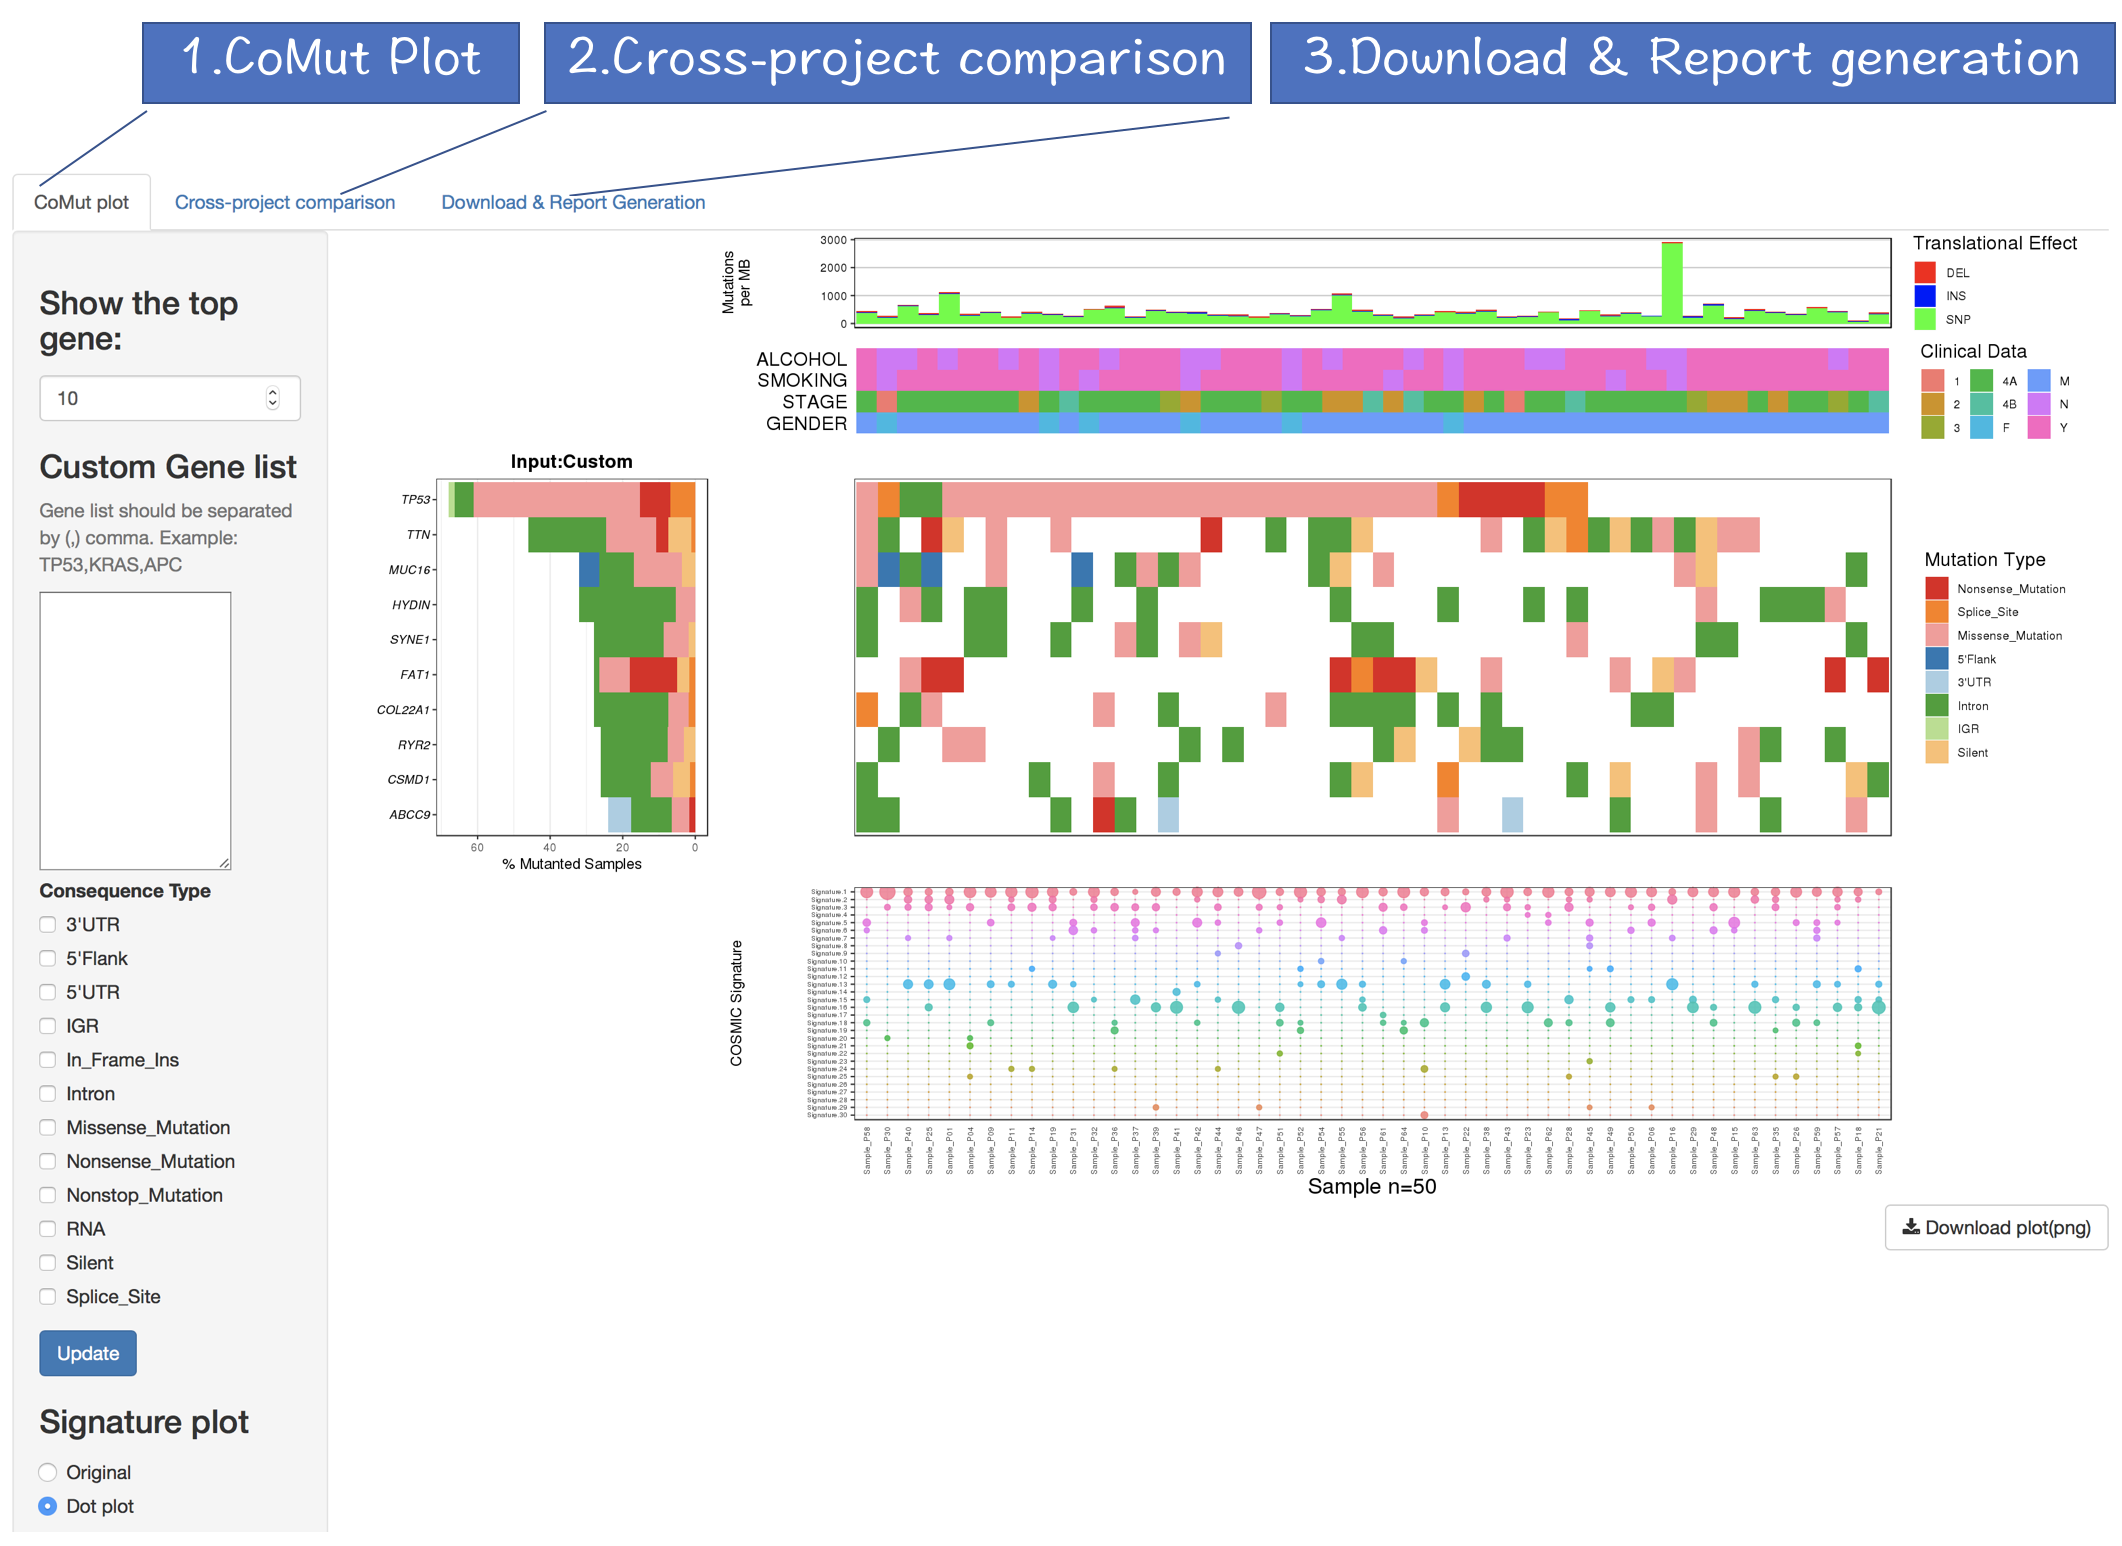
The output of CoMutPlotter consists of three major components:
- CoMut Plot
- Cross-project comparison
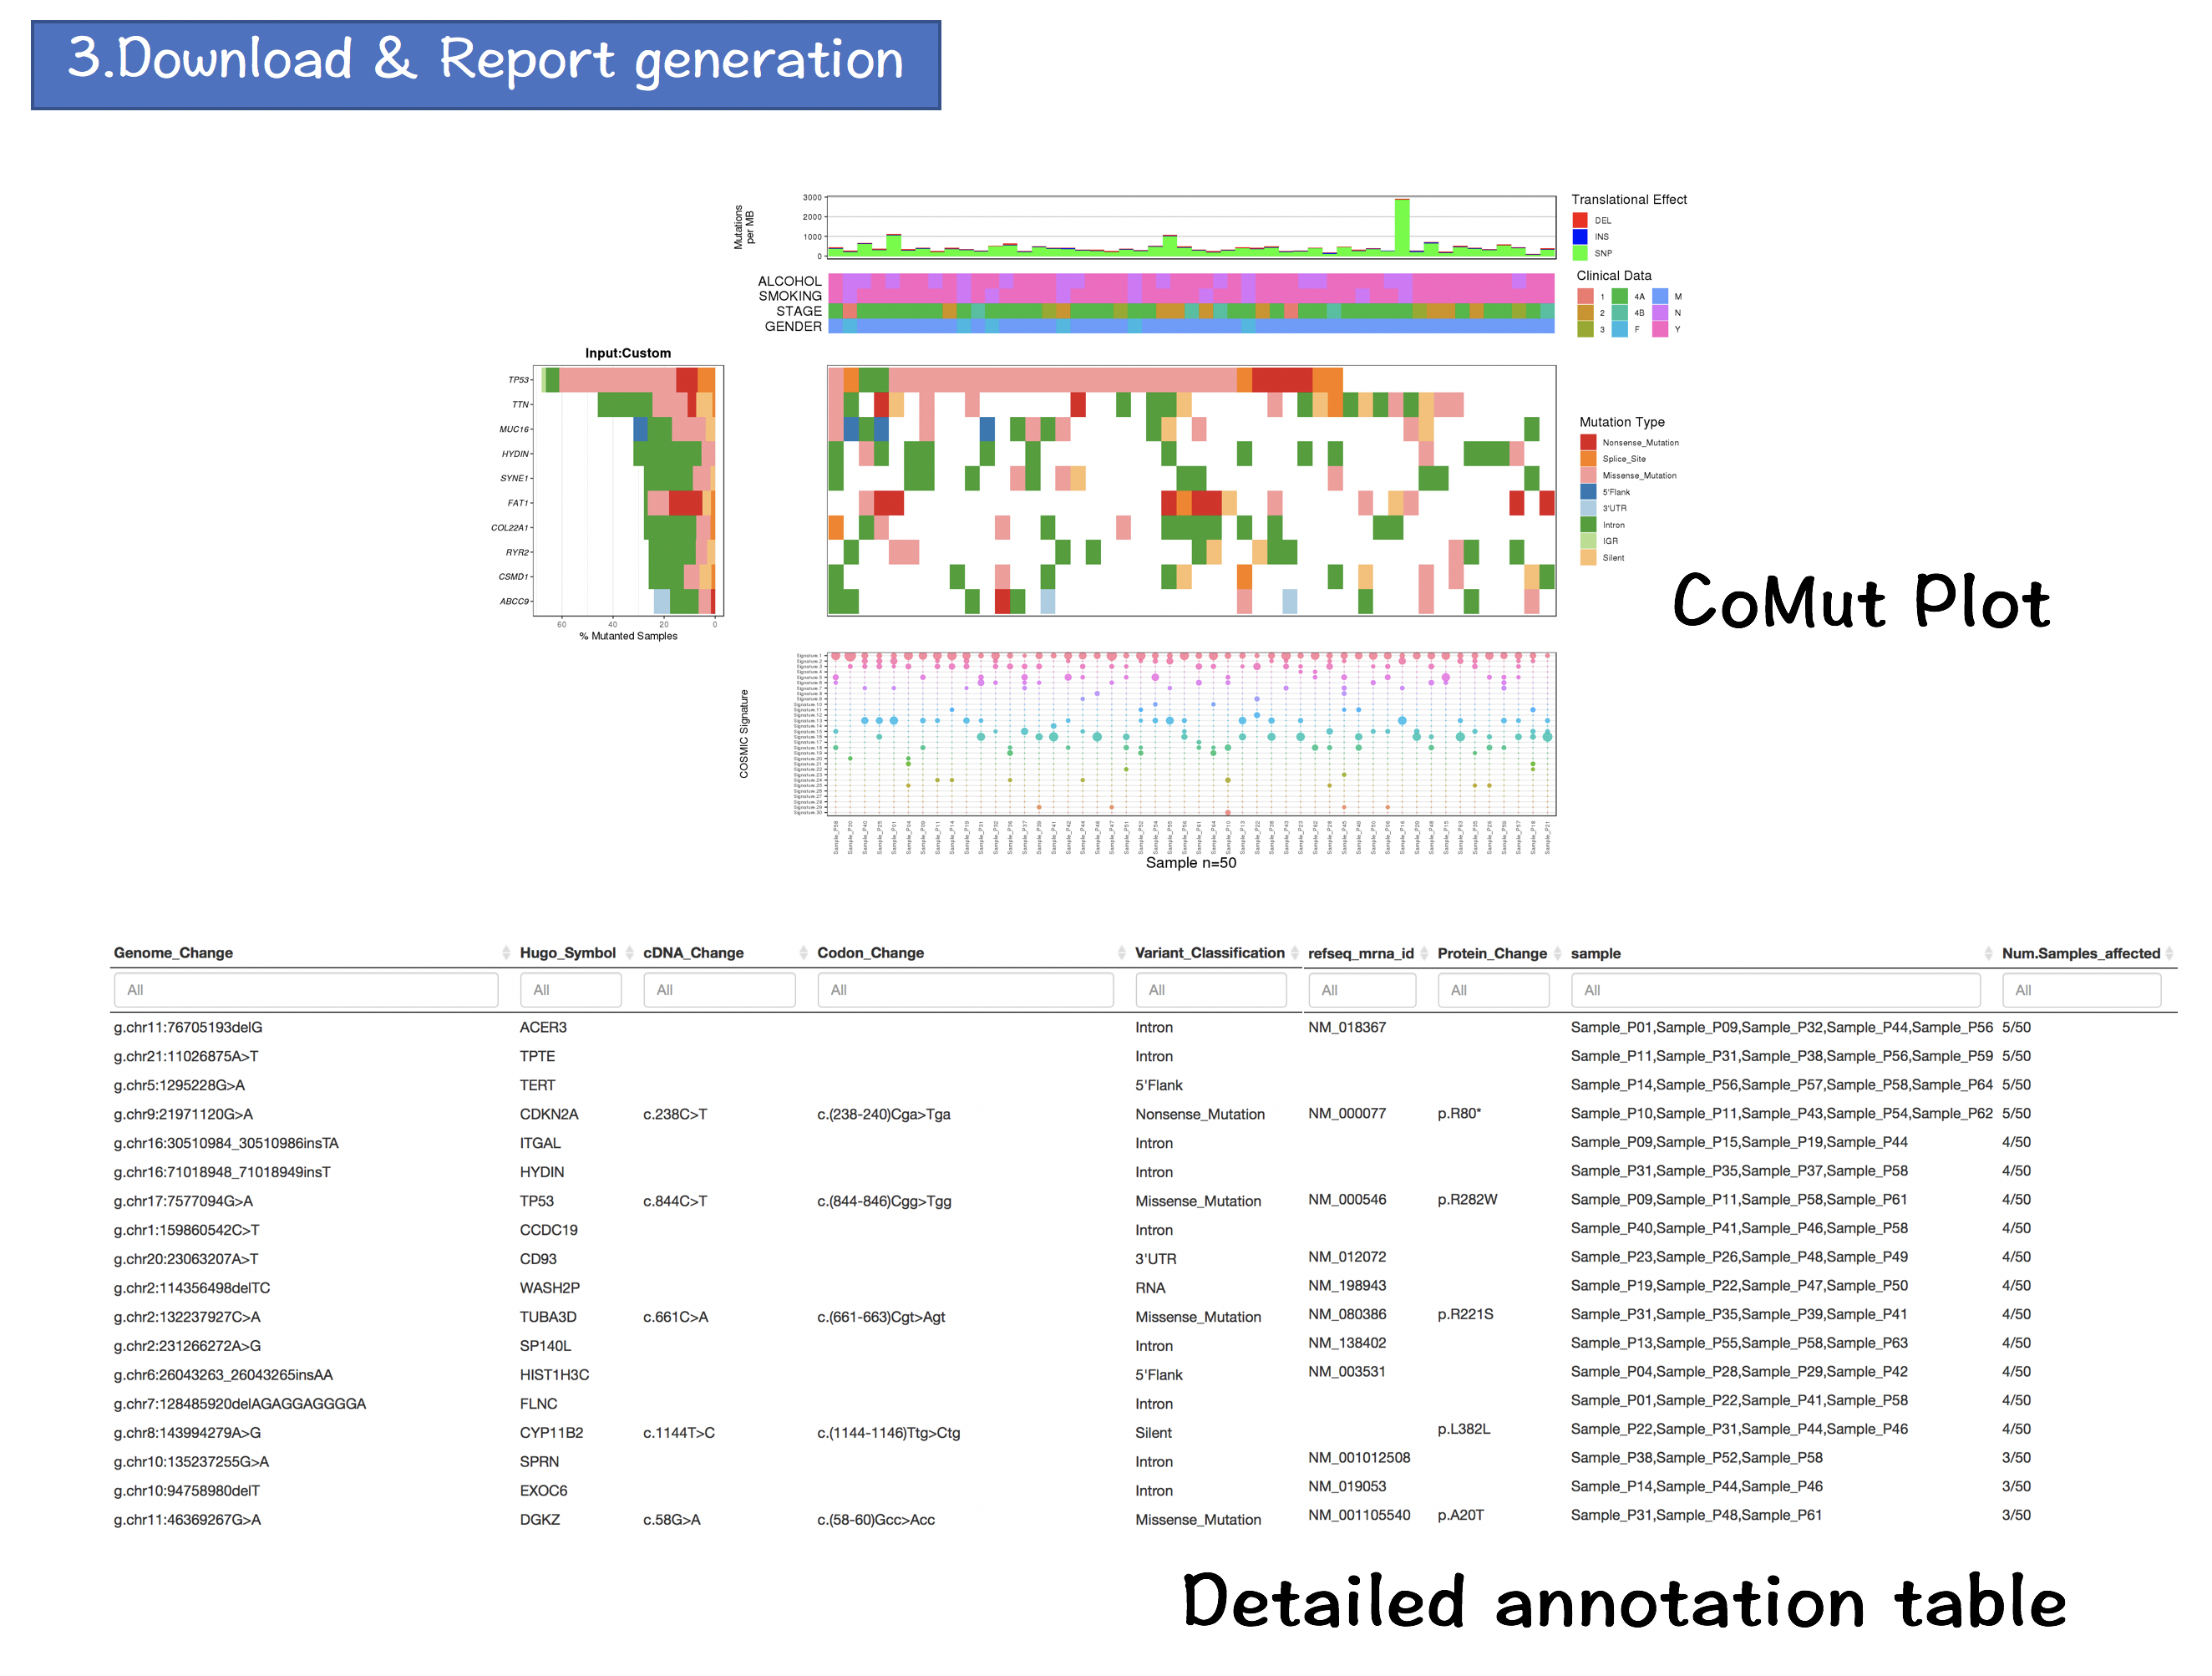
- Download & Report Generation
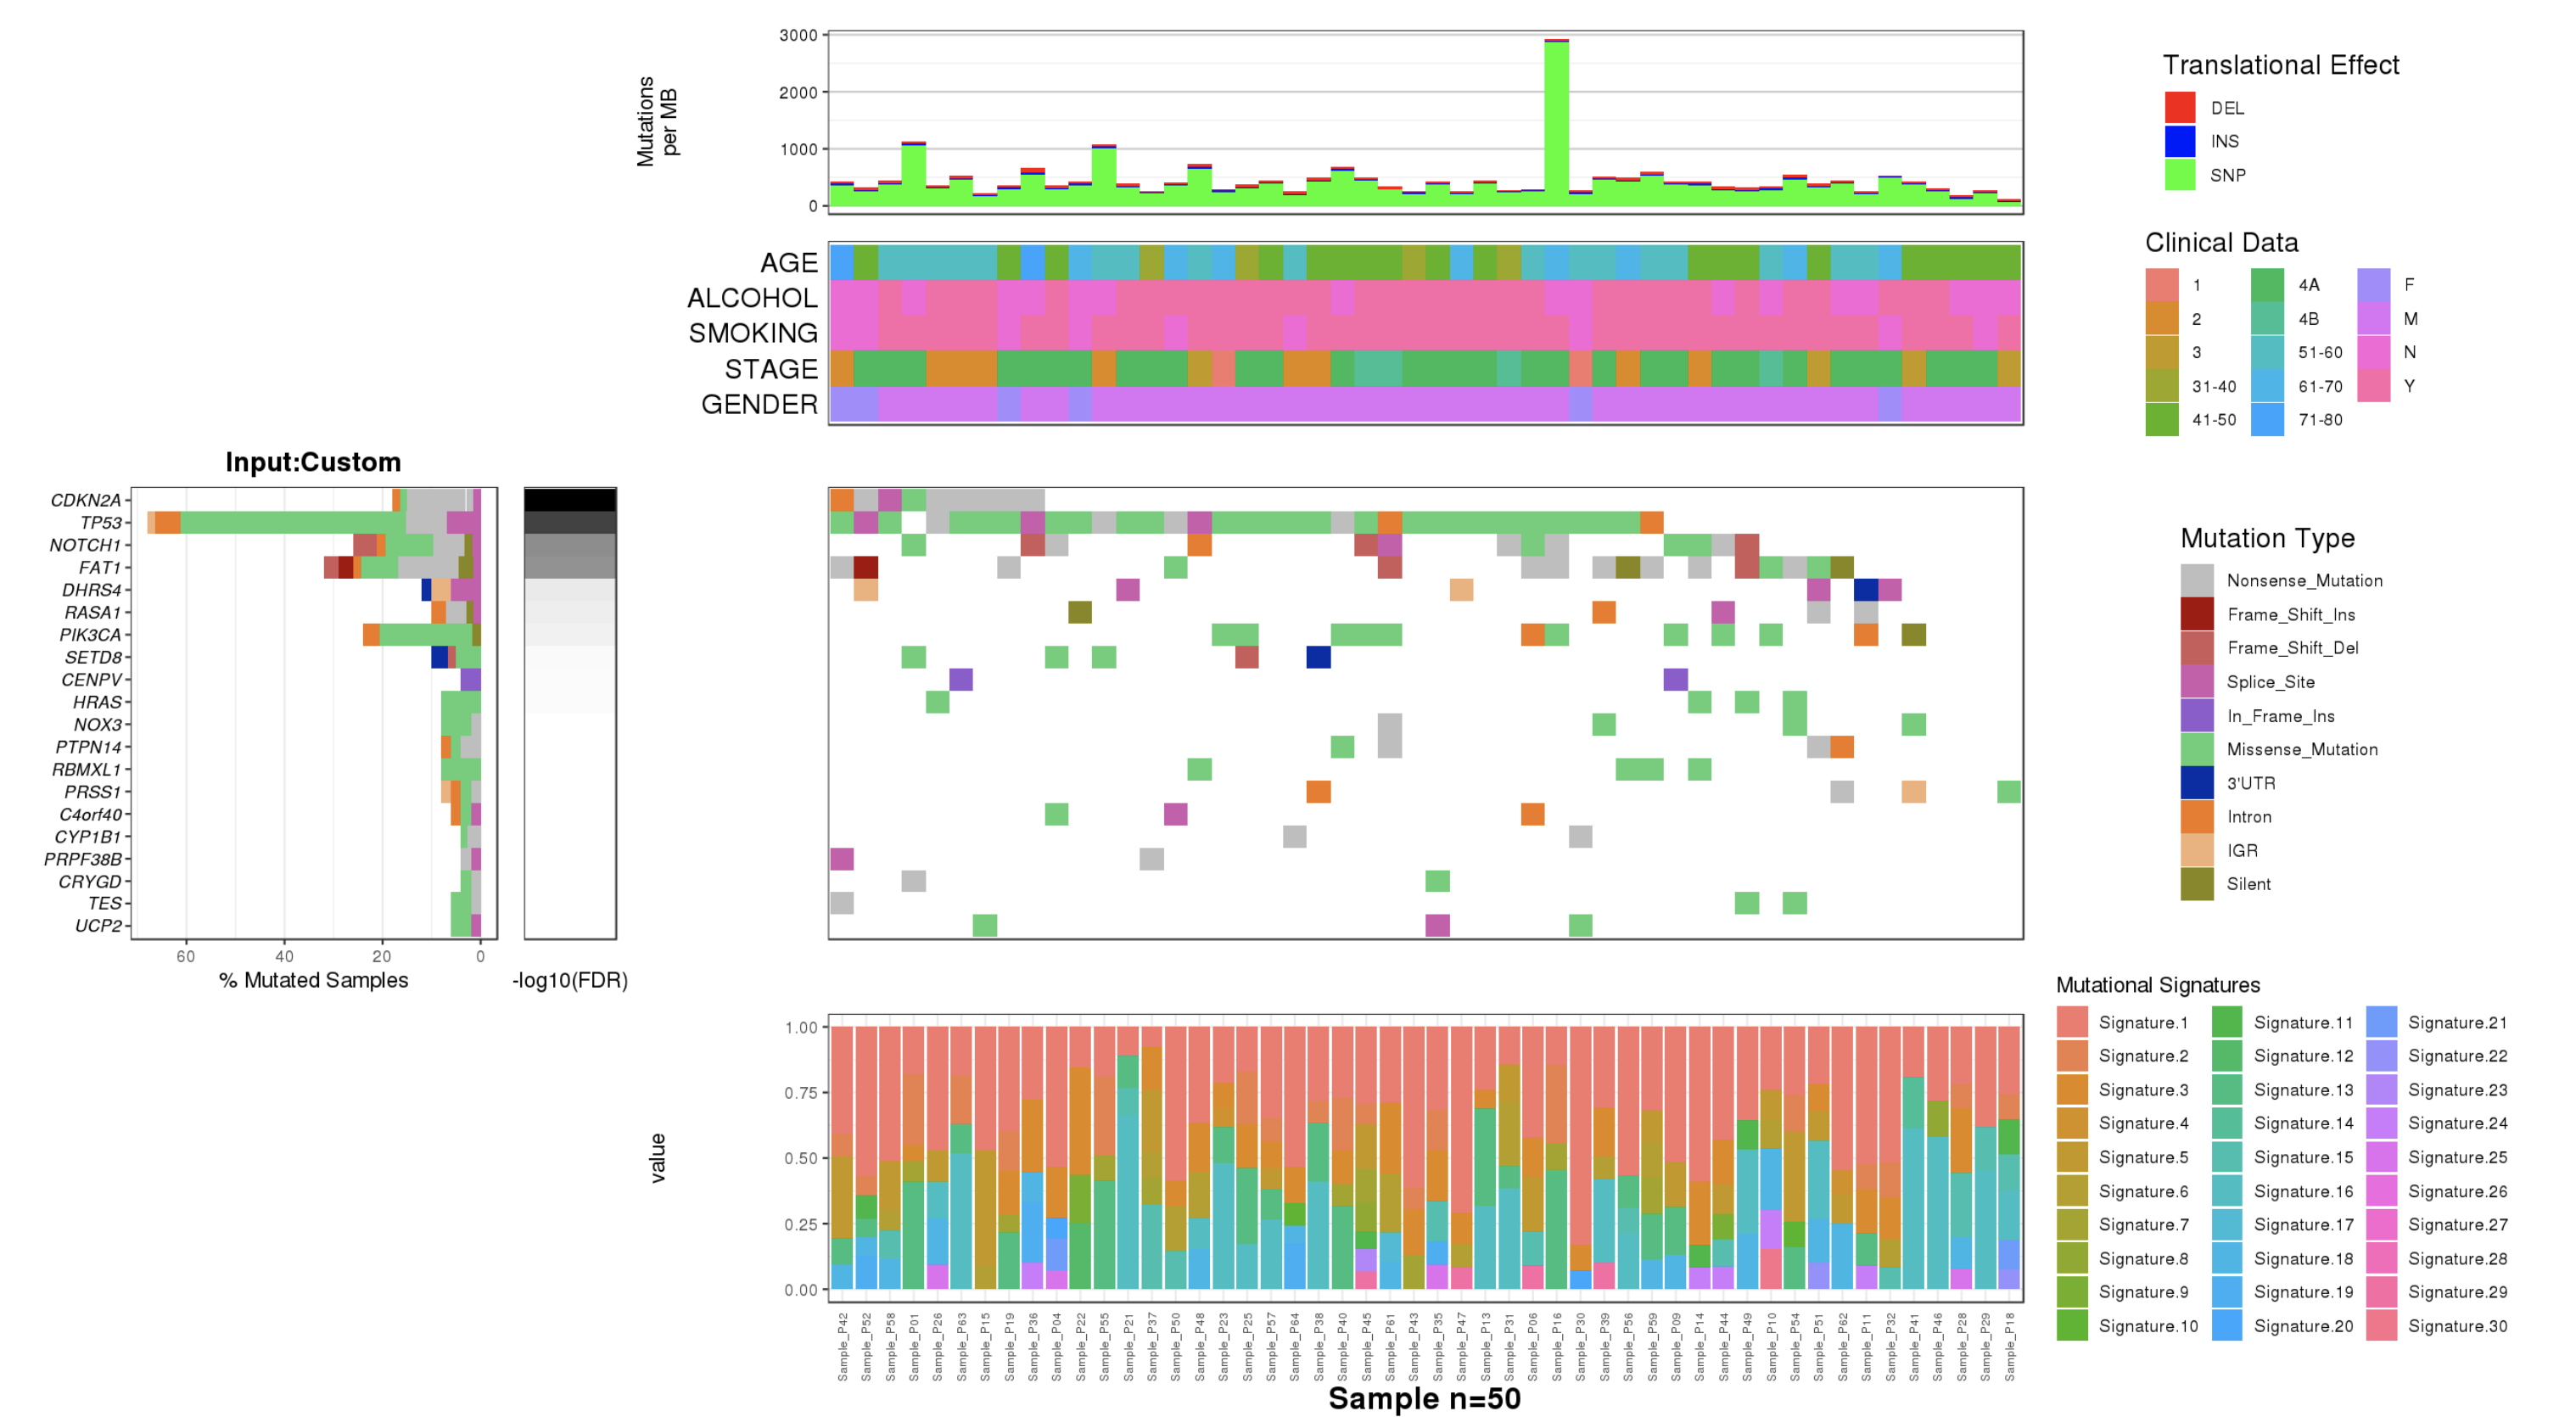
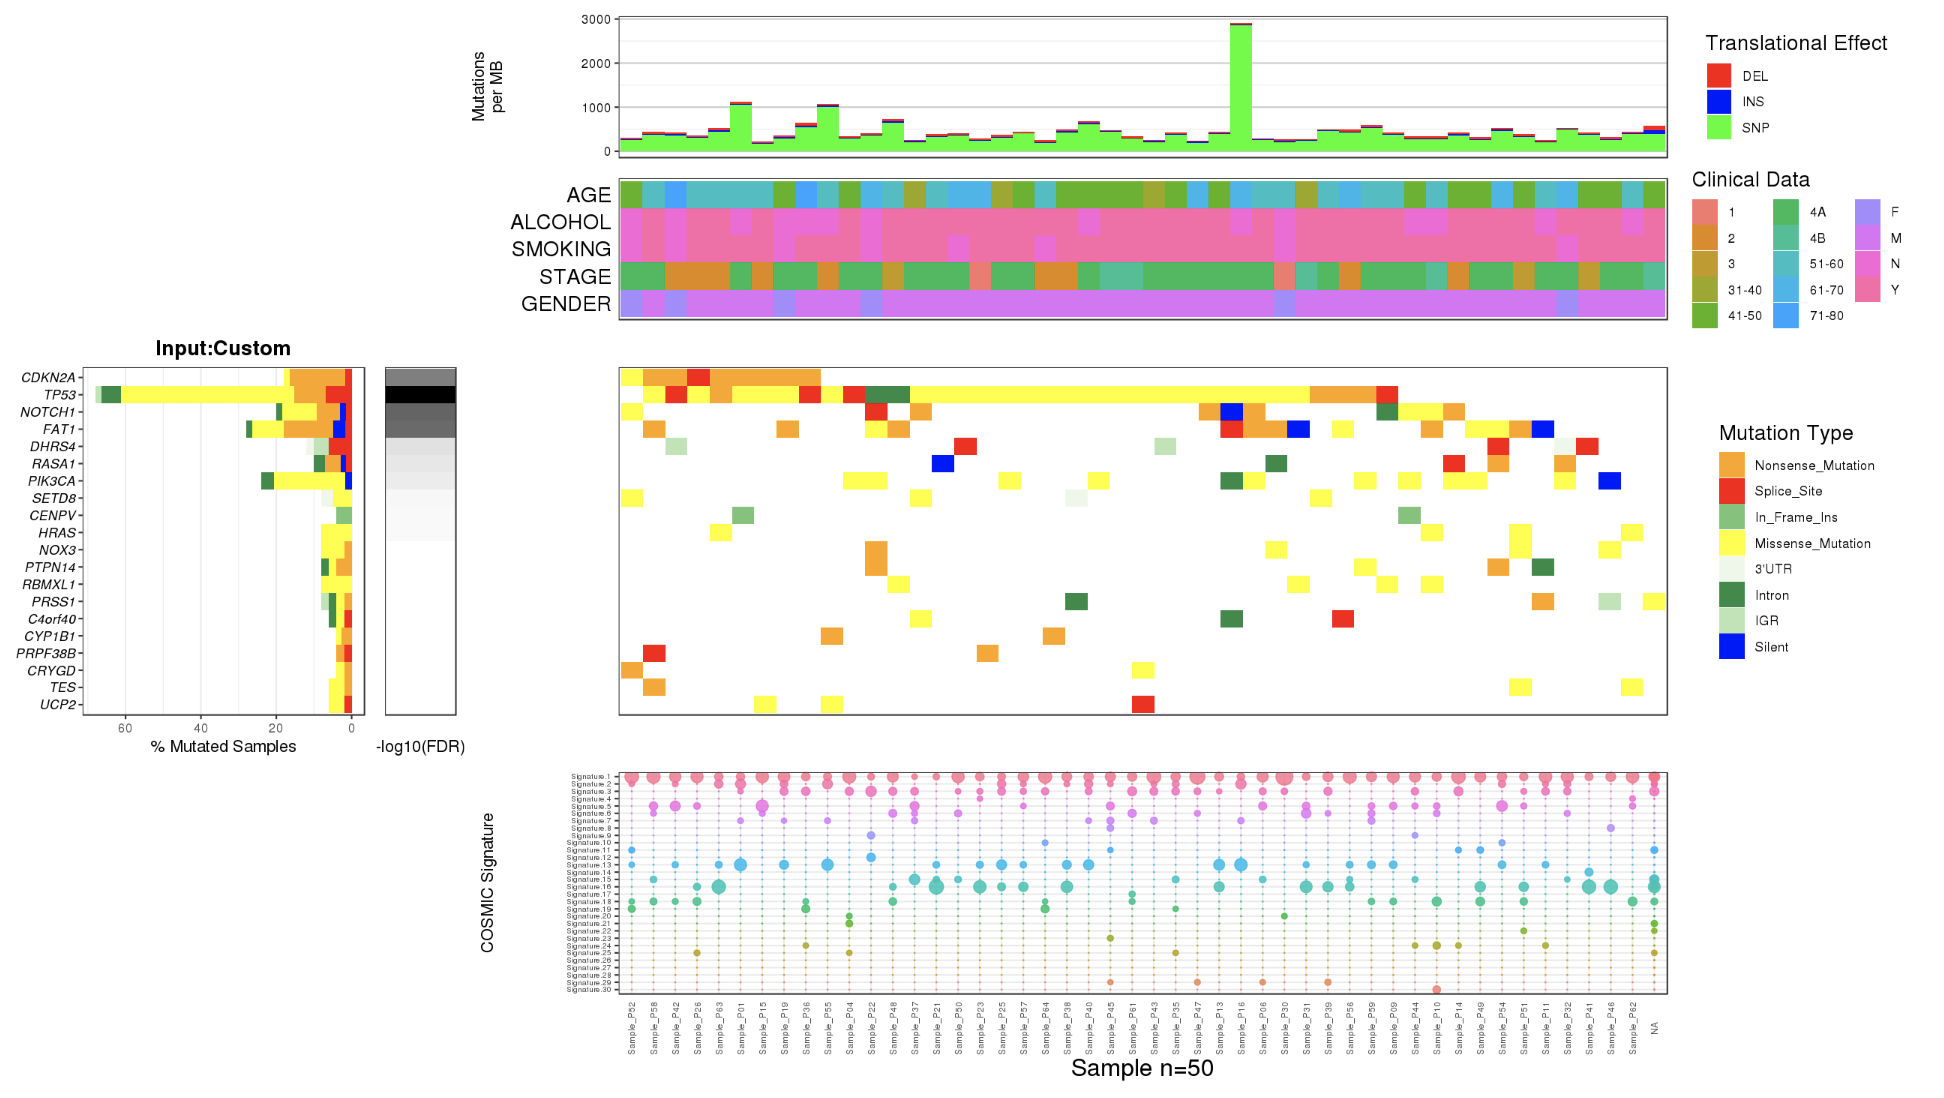
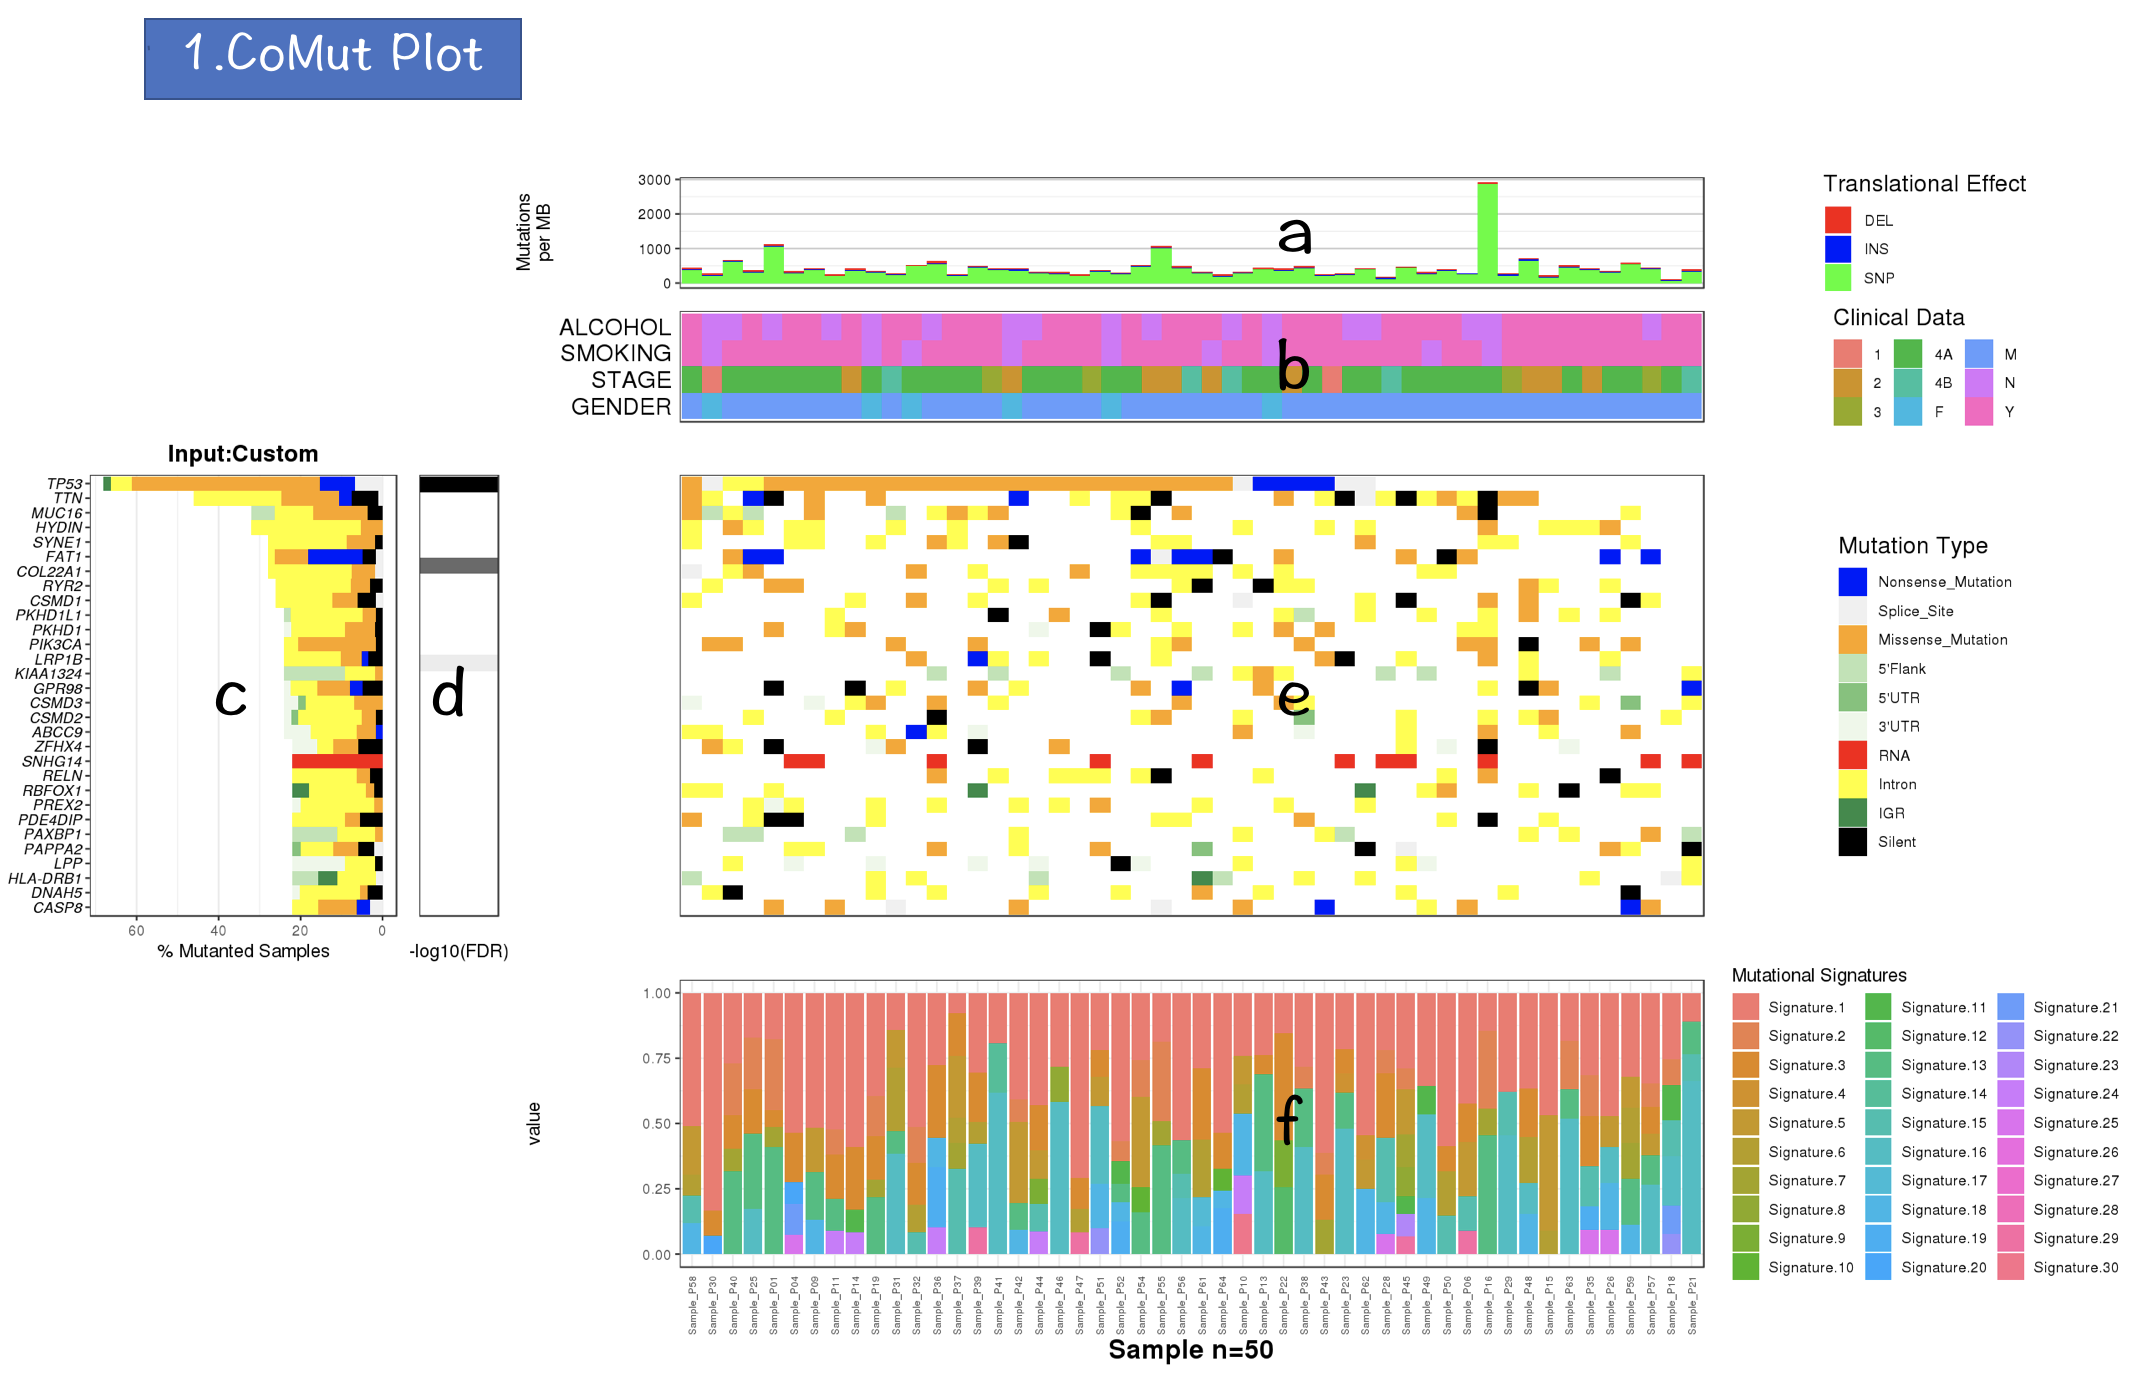
2.4.1 CoMut Plot
- Mutation rate per sample stratified by tanslational effects such as SNPs, Insertions and Deletions
The mutation rate is calculated as number of somatic mutations per million bases. - Sample metadata is displayed as heatmap
- Gene mutation is displayed as bar plot and stratified by various mutation types
- Significantly mutated genes identified by MutSigCV by FDR (q) <=0.1
The color gradient is rendered according to -log10(FDR)
- Mutation landscape and effects are displayed as heatmap
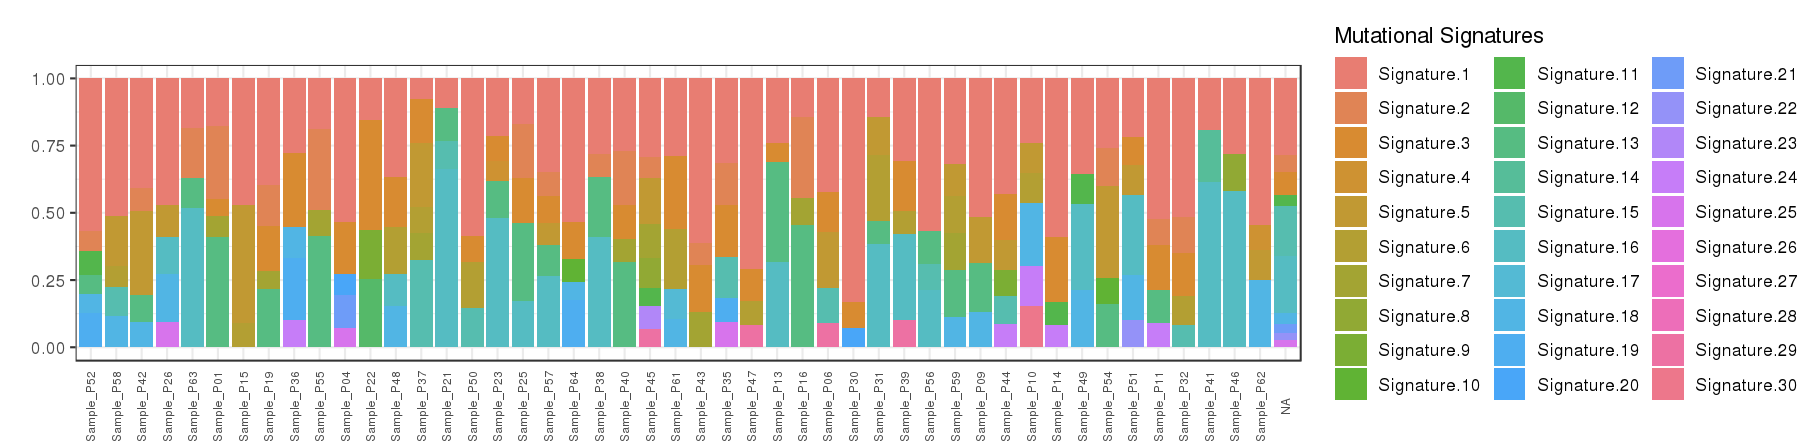
- Contributions of 30 COSMIC signatures in individual samples are displayed using % stacked bar chart
2.4.2 Interactive filters
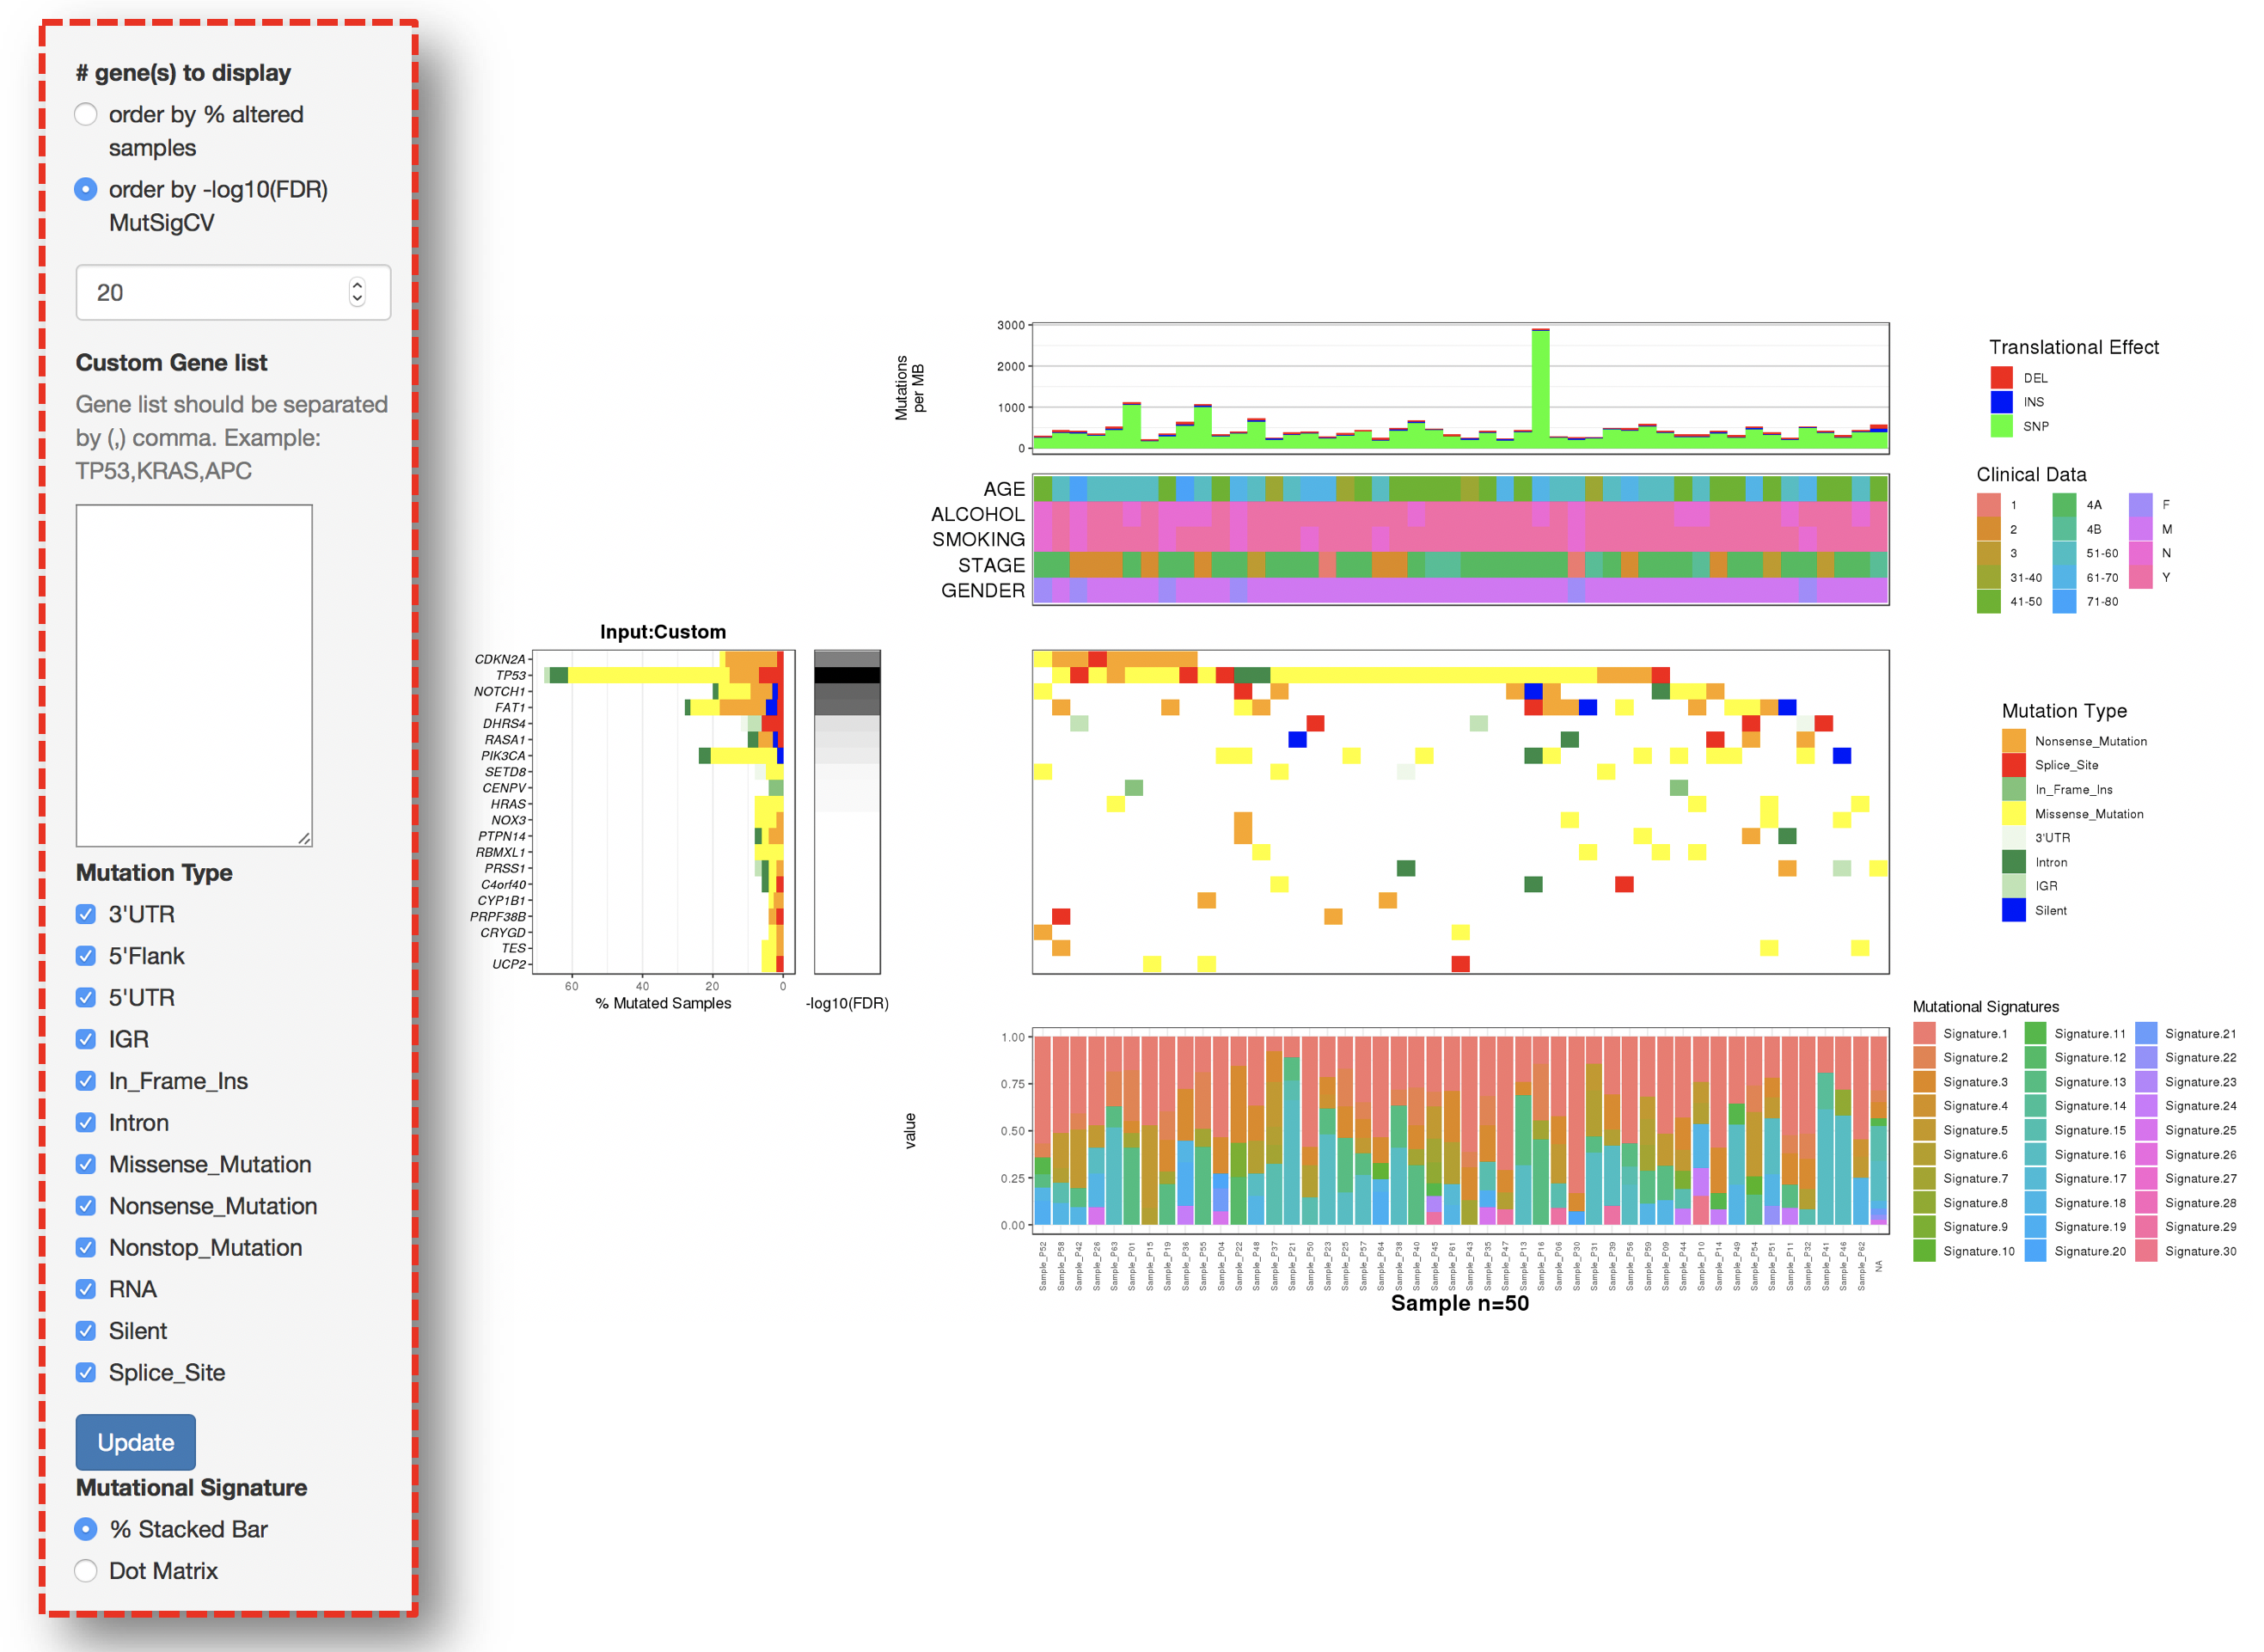
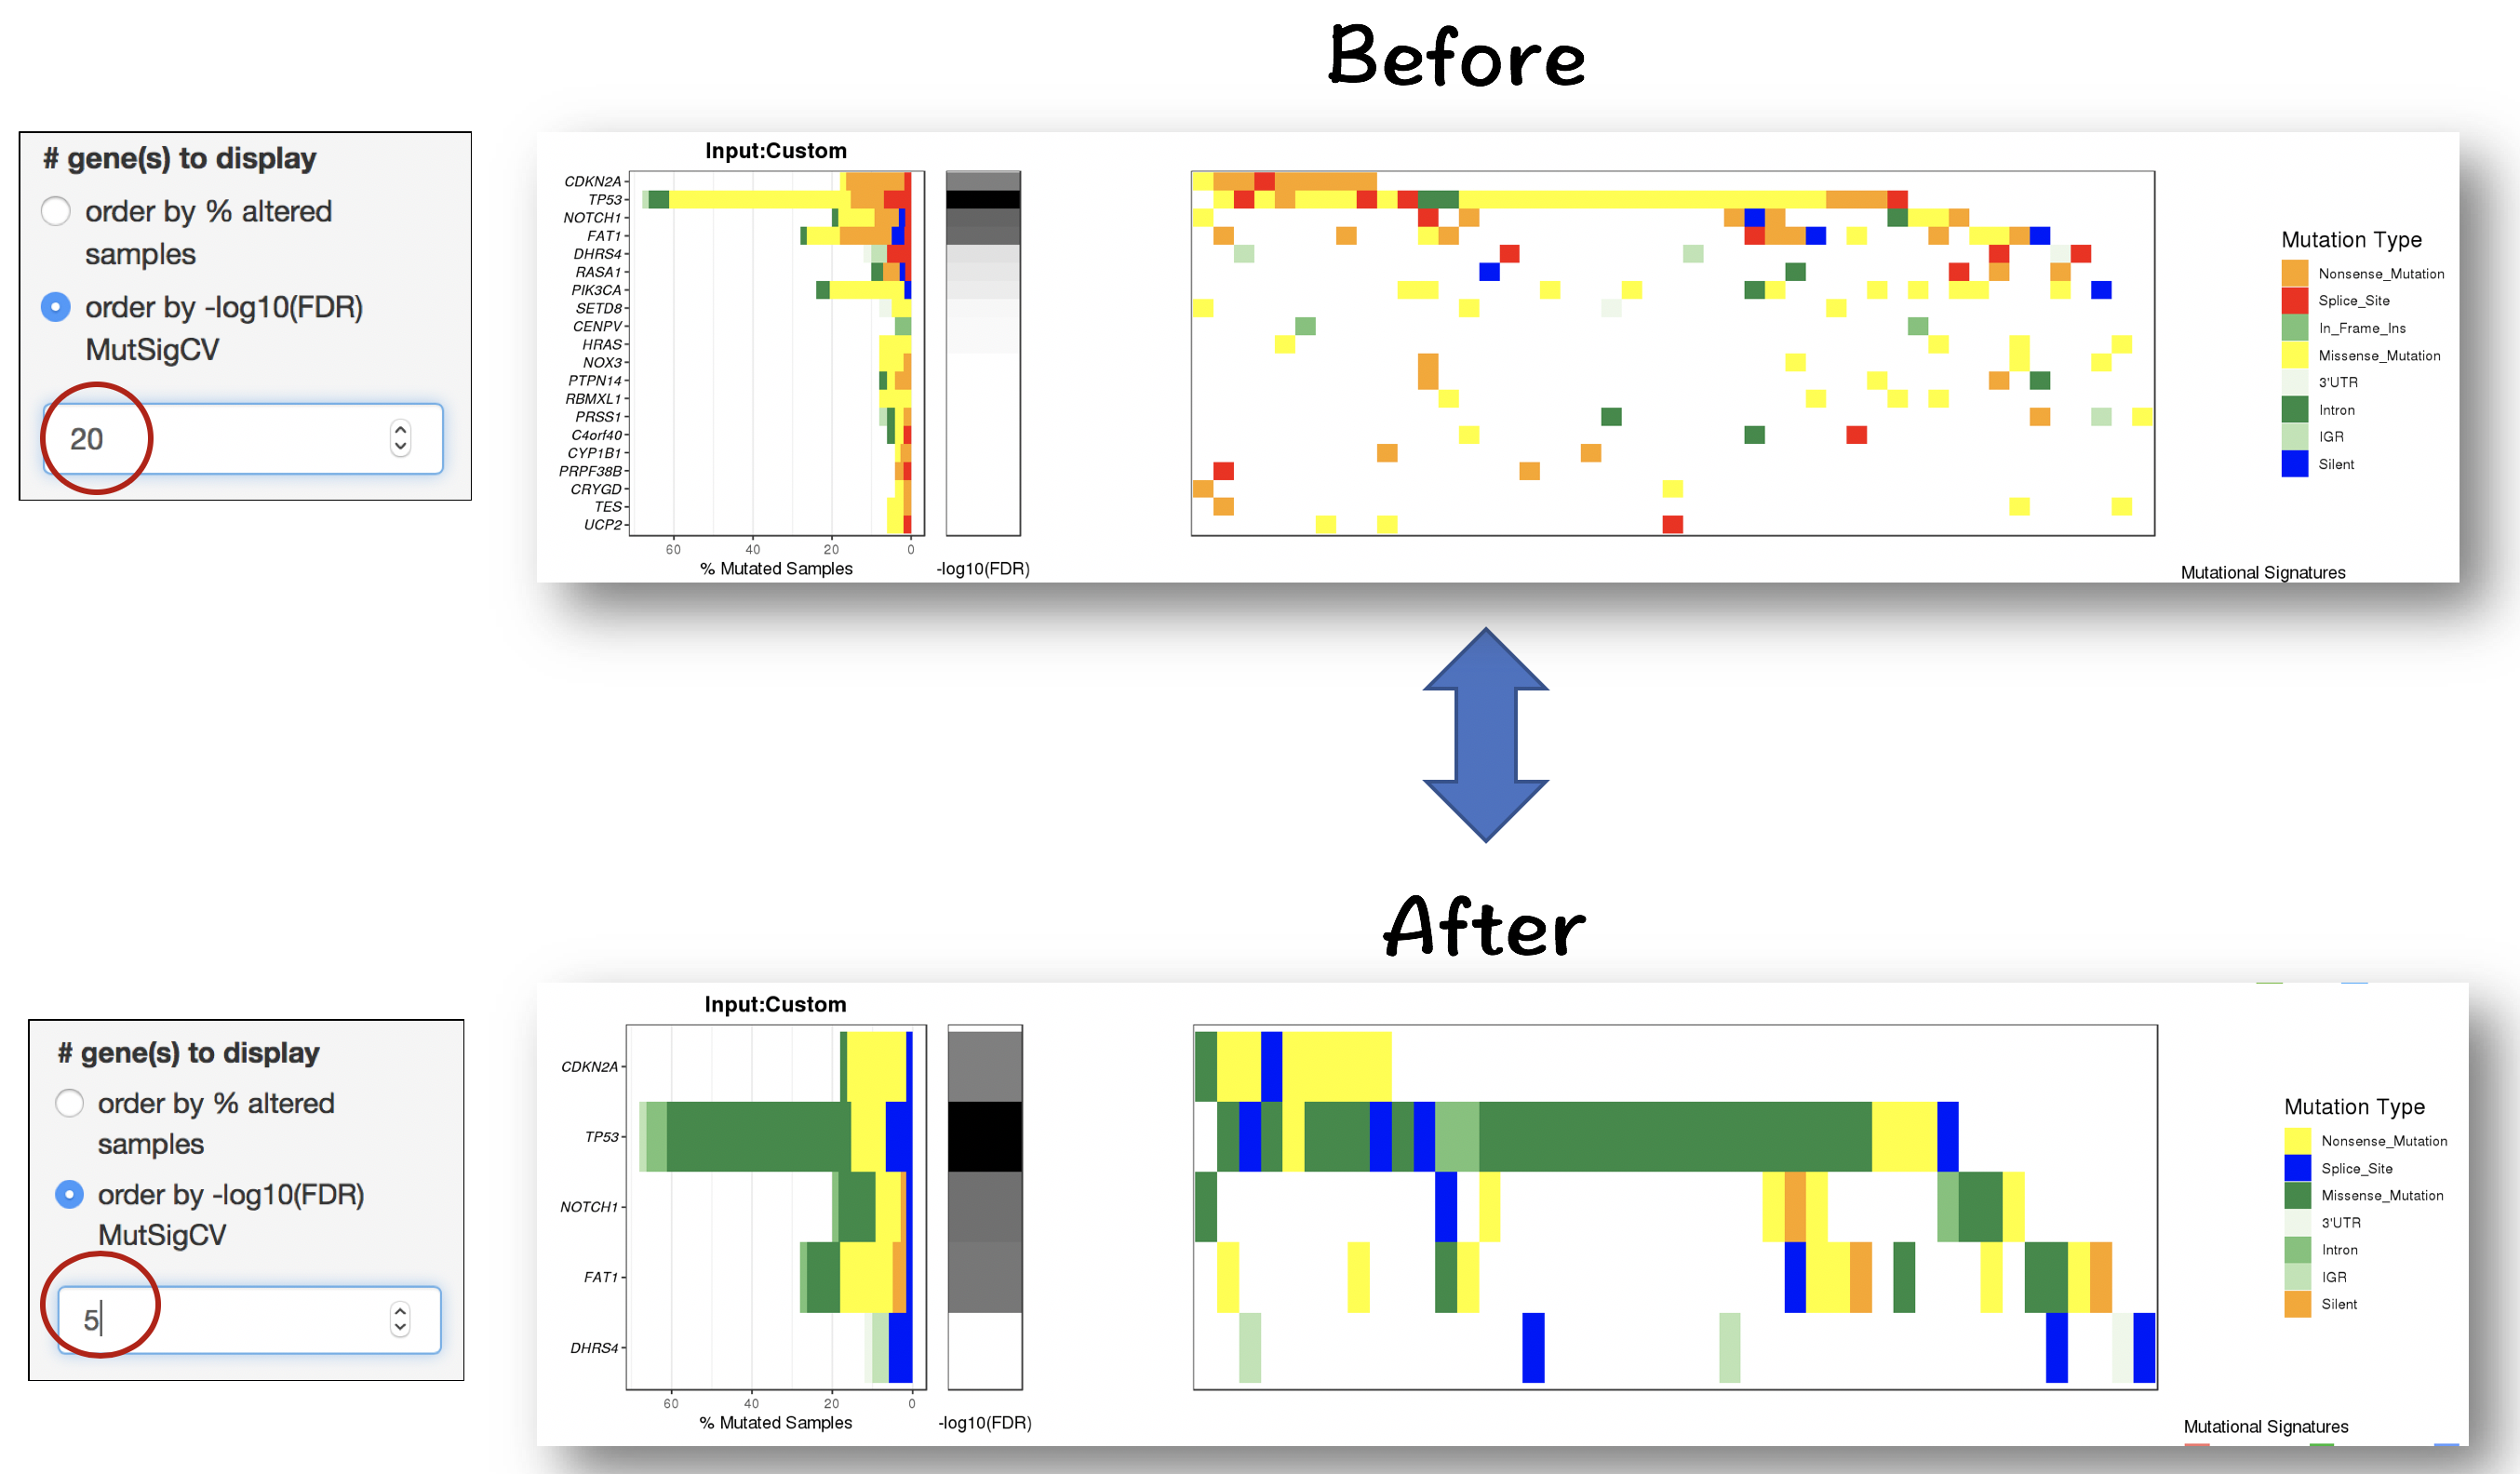
2.4.2.1 Filter for displaying the most frequently/signifiantly mutated genes
- Order by % altered samples
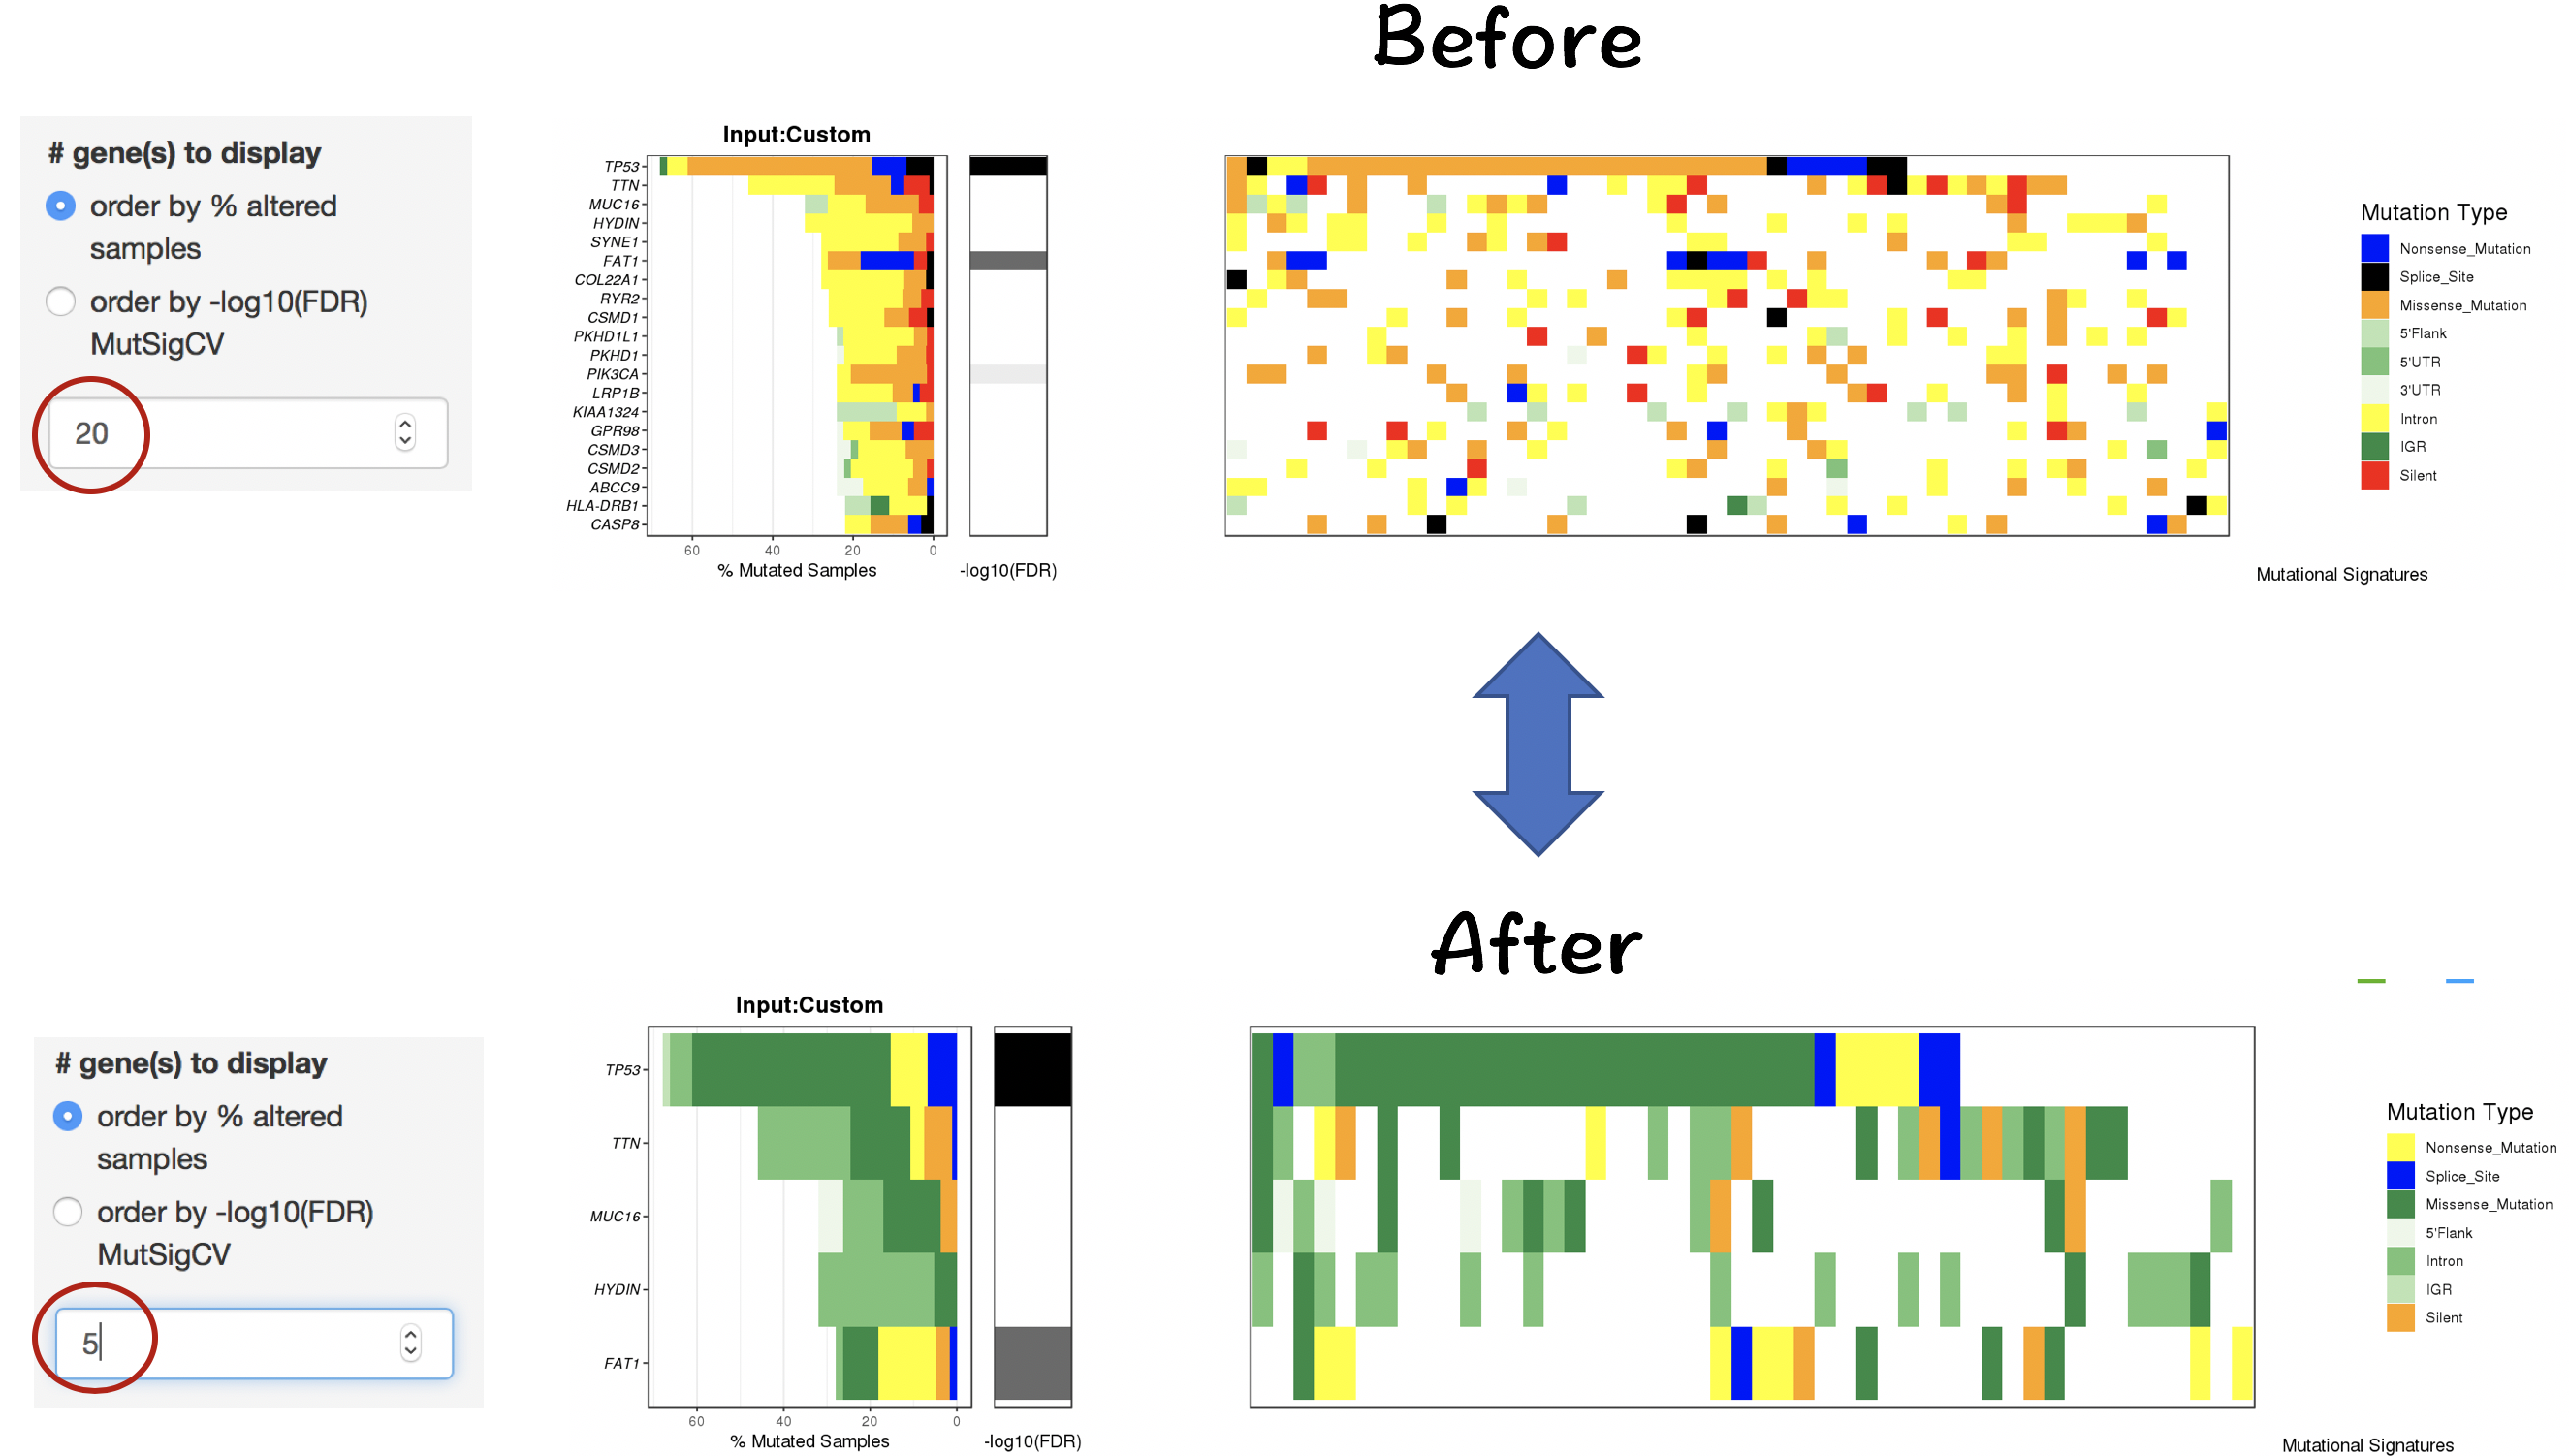
- Order by -log10(FDR) of MutSigCV
2.4.2.2 Filter for selecting genes of interest
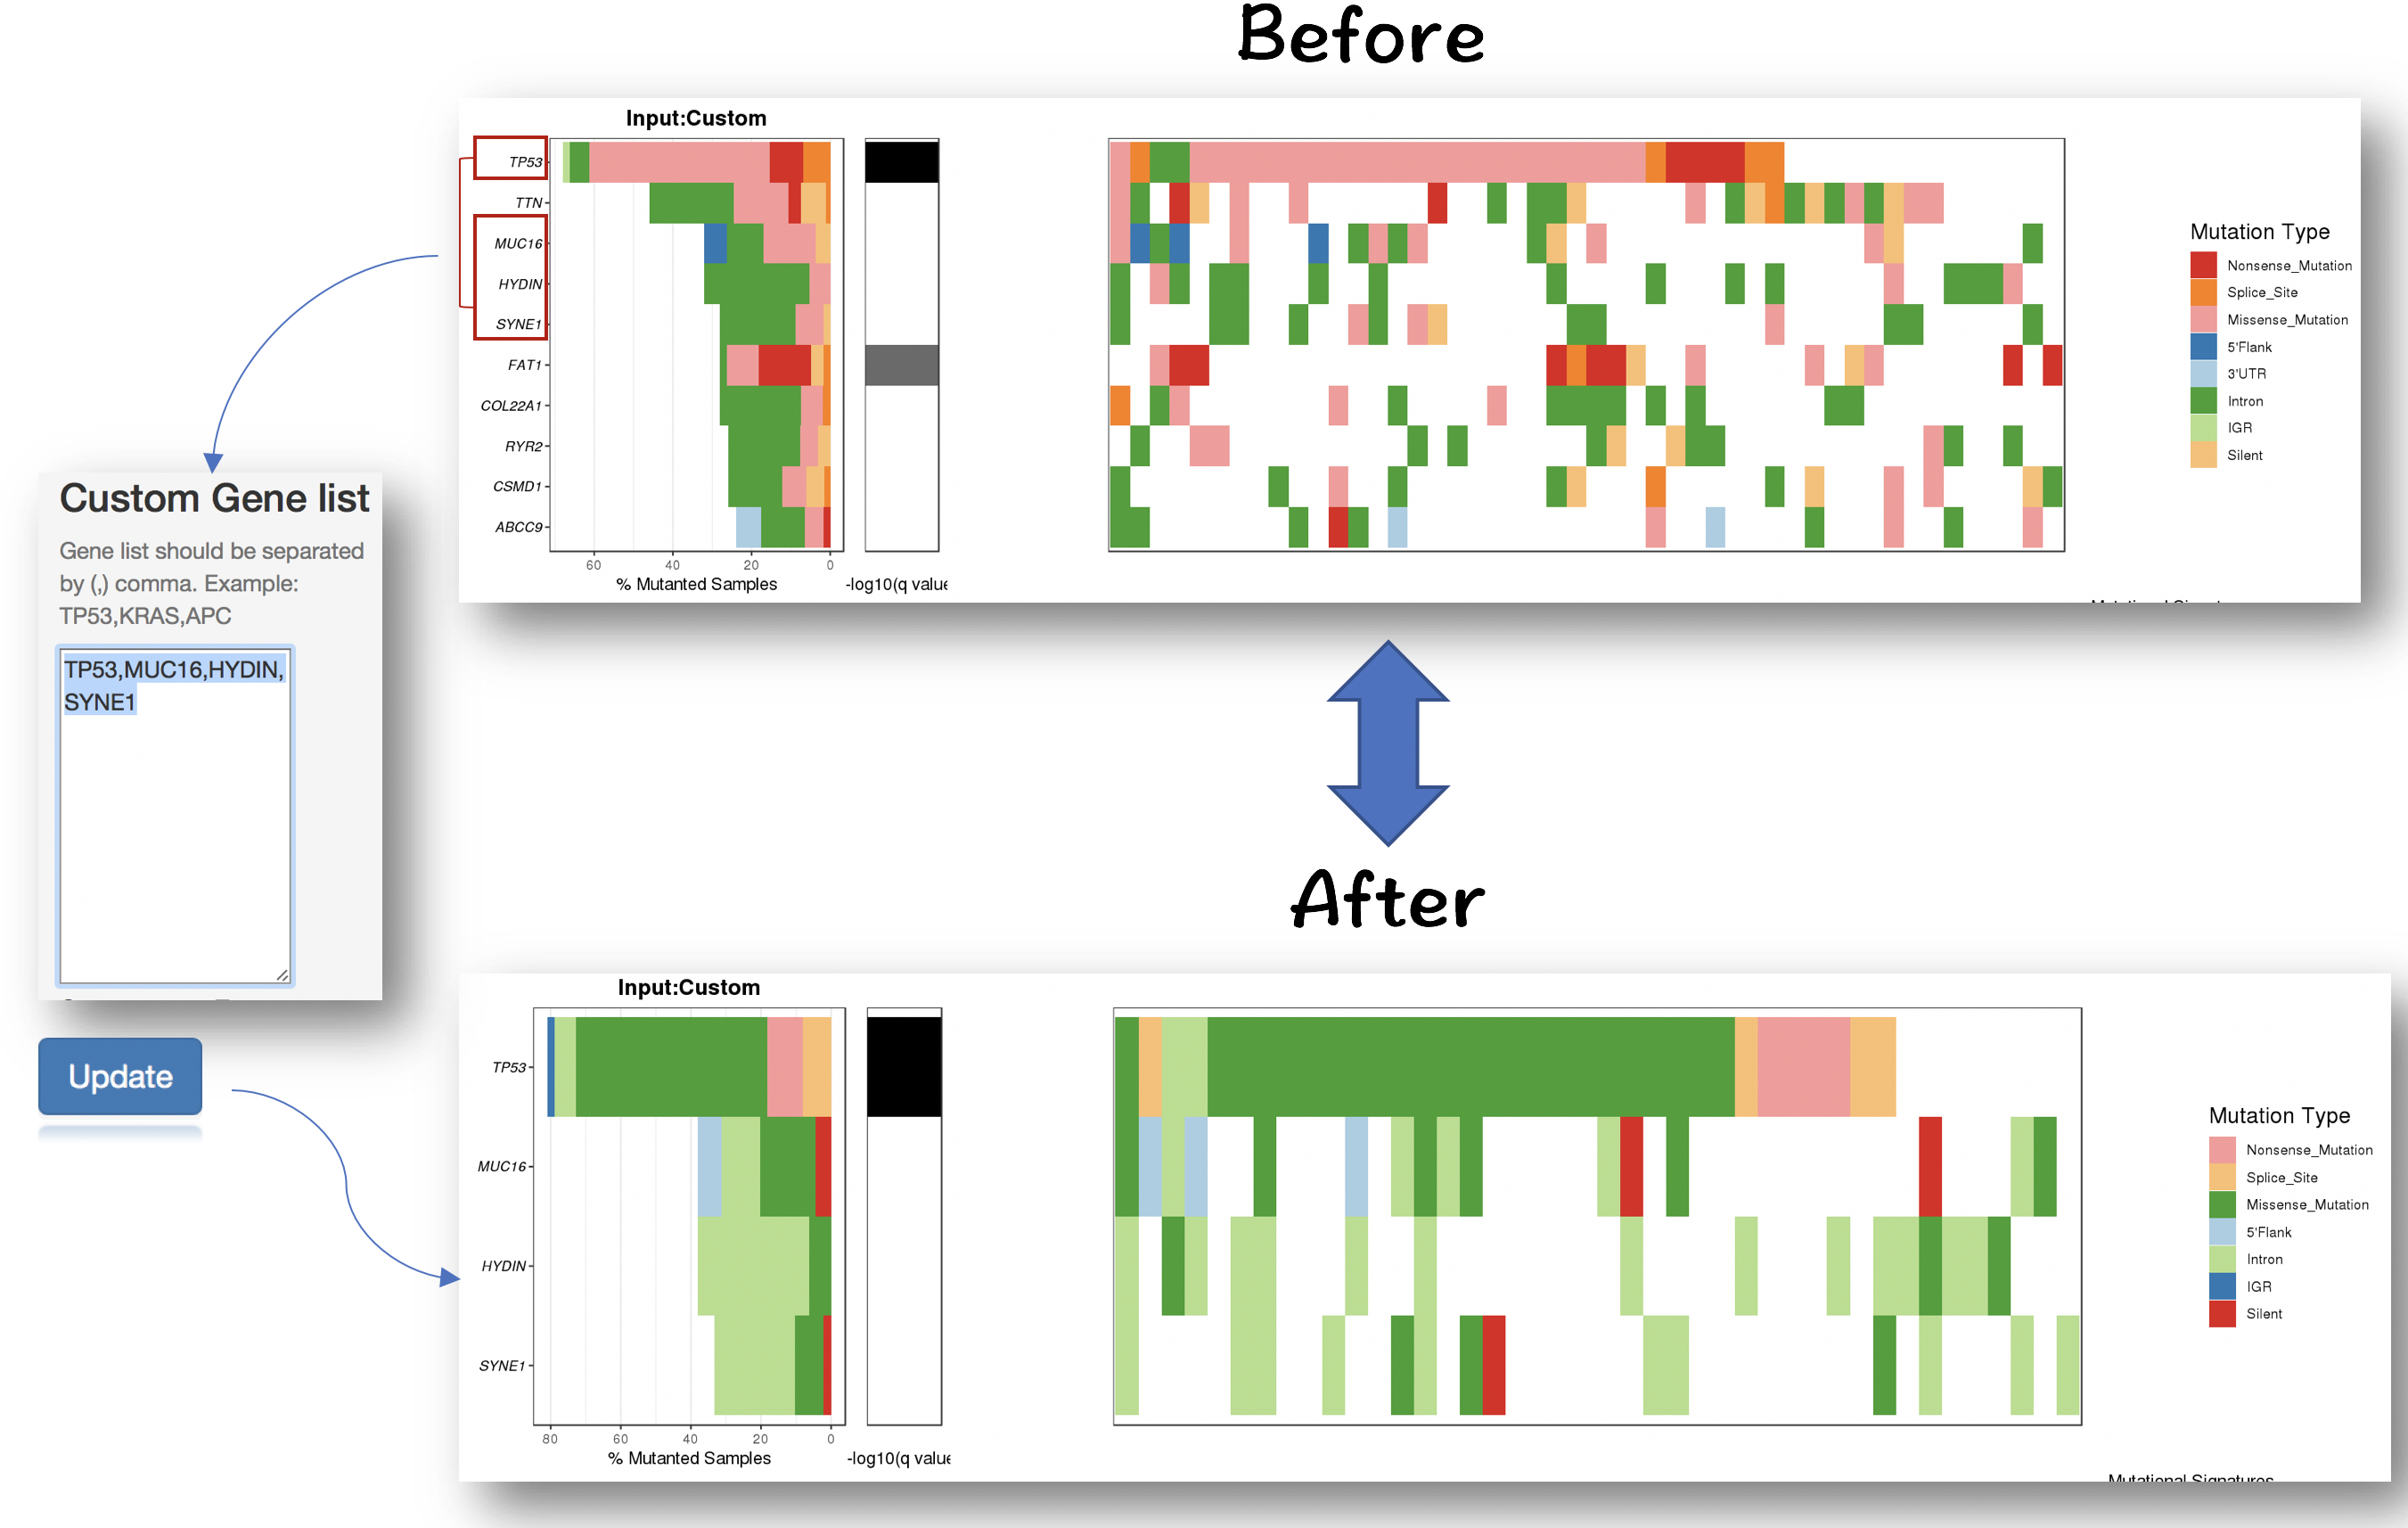
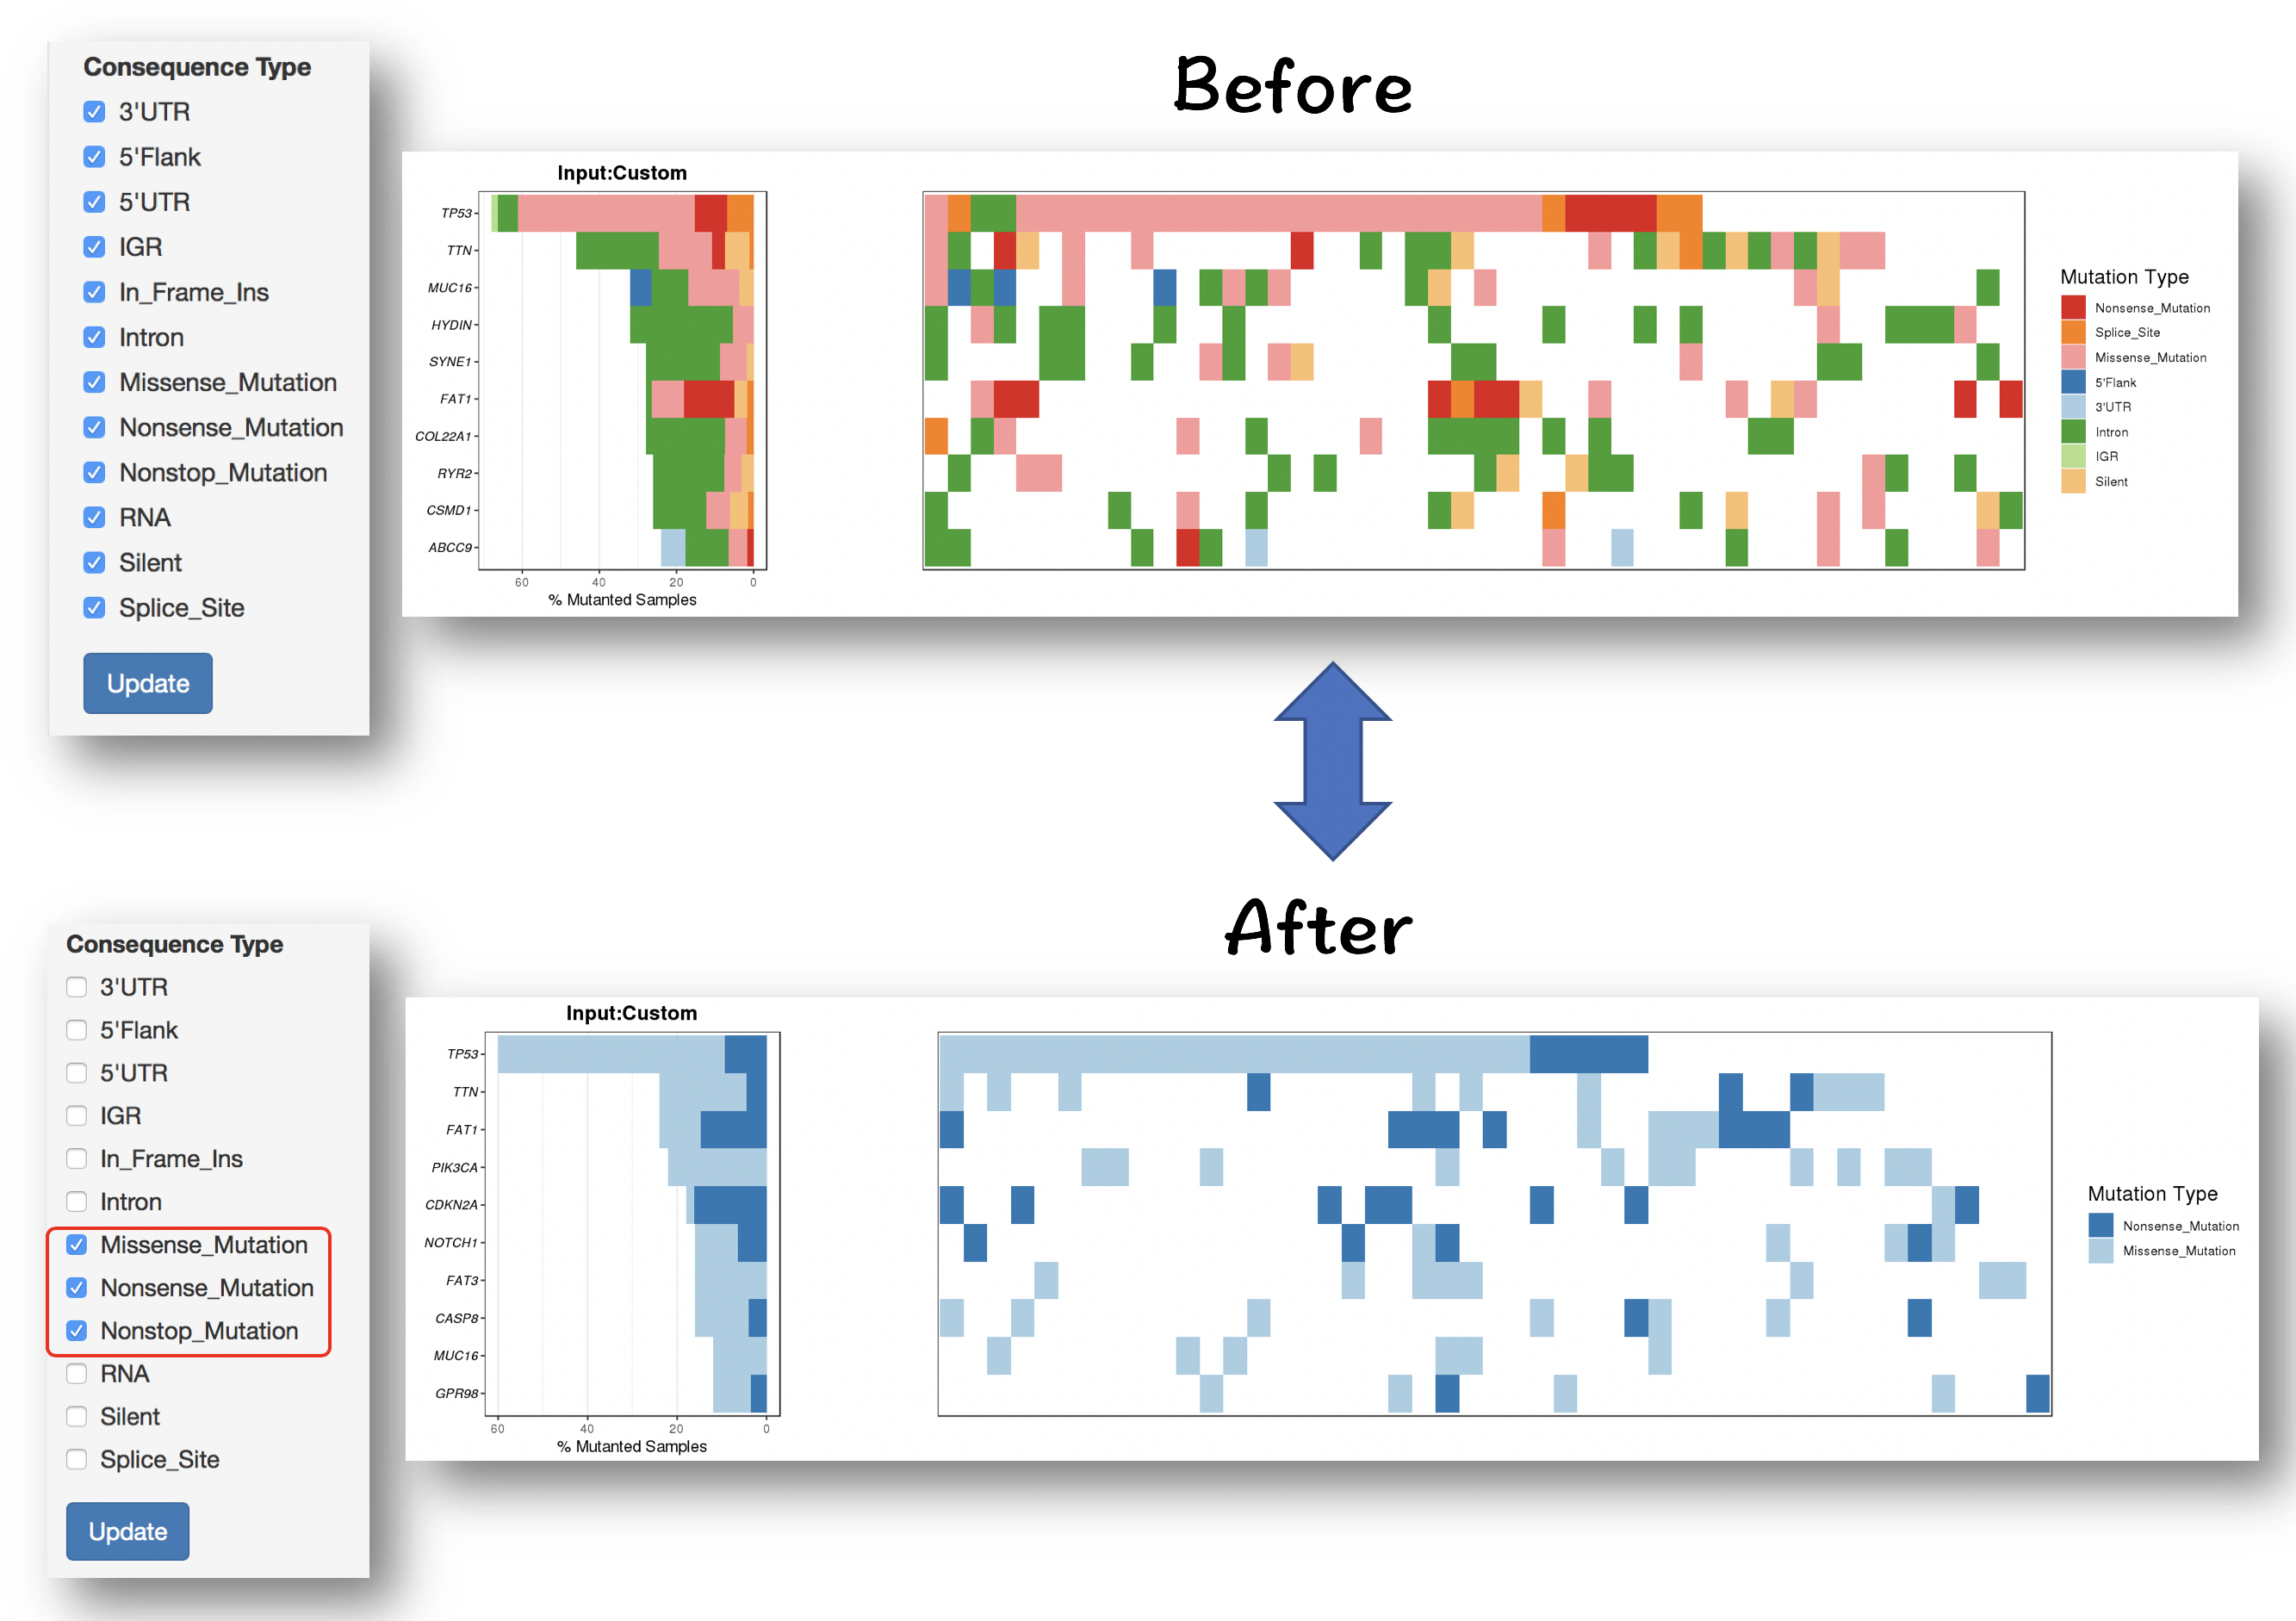
#### Filter for selecting specific mutation types
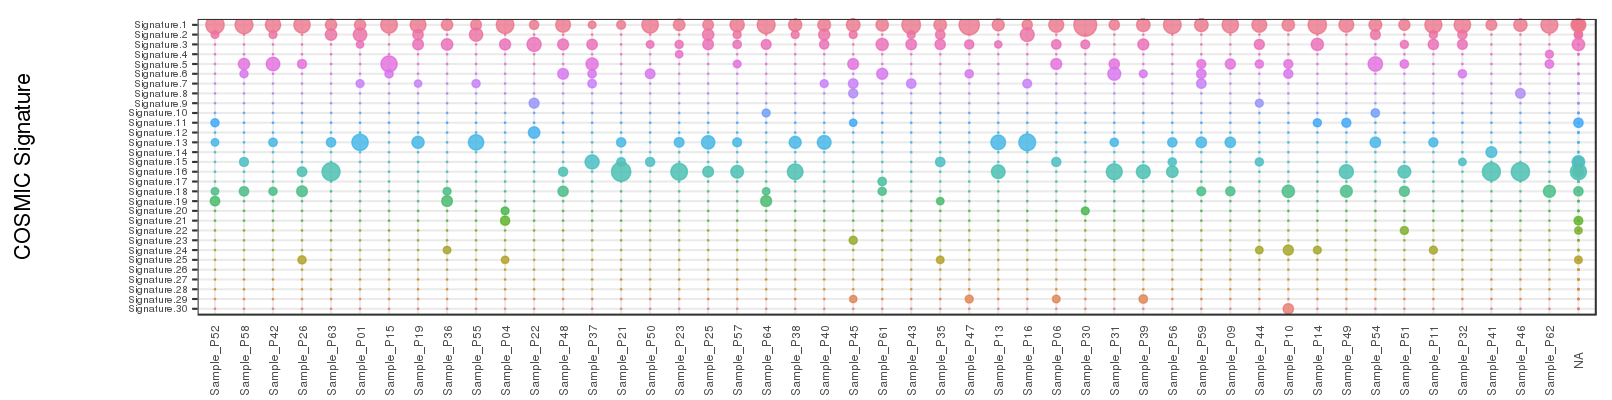
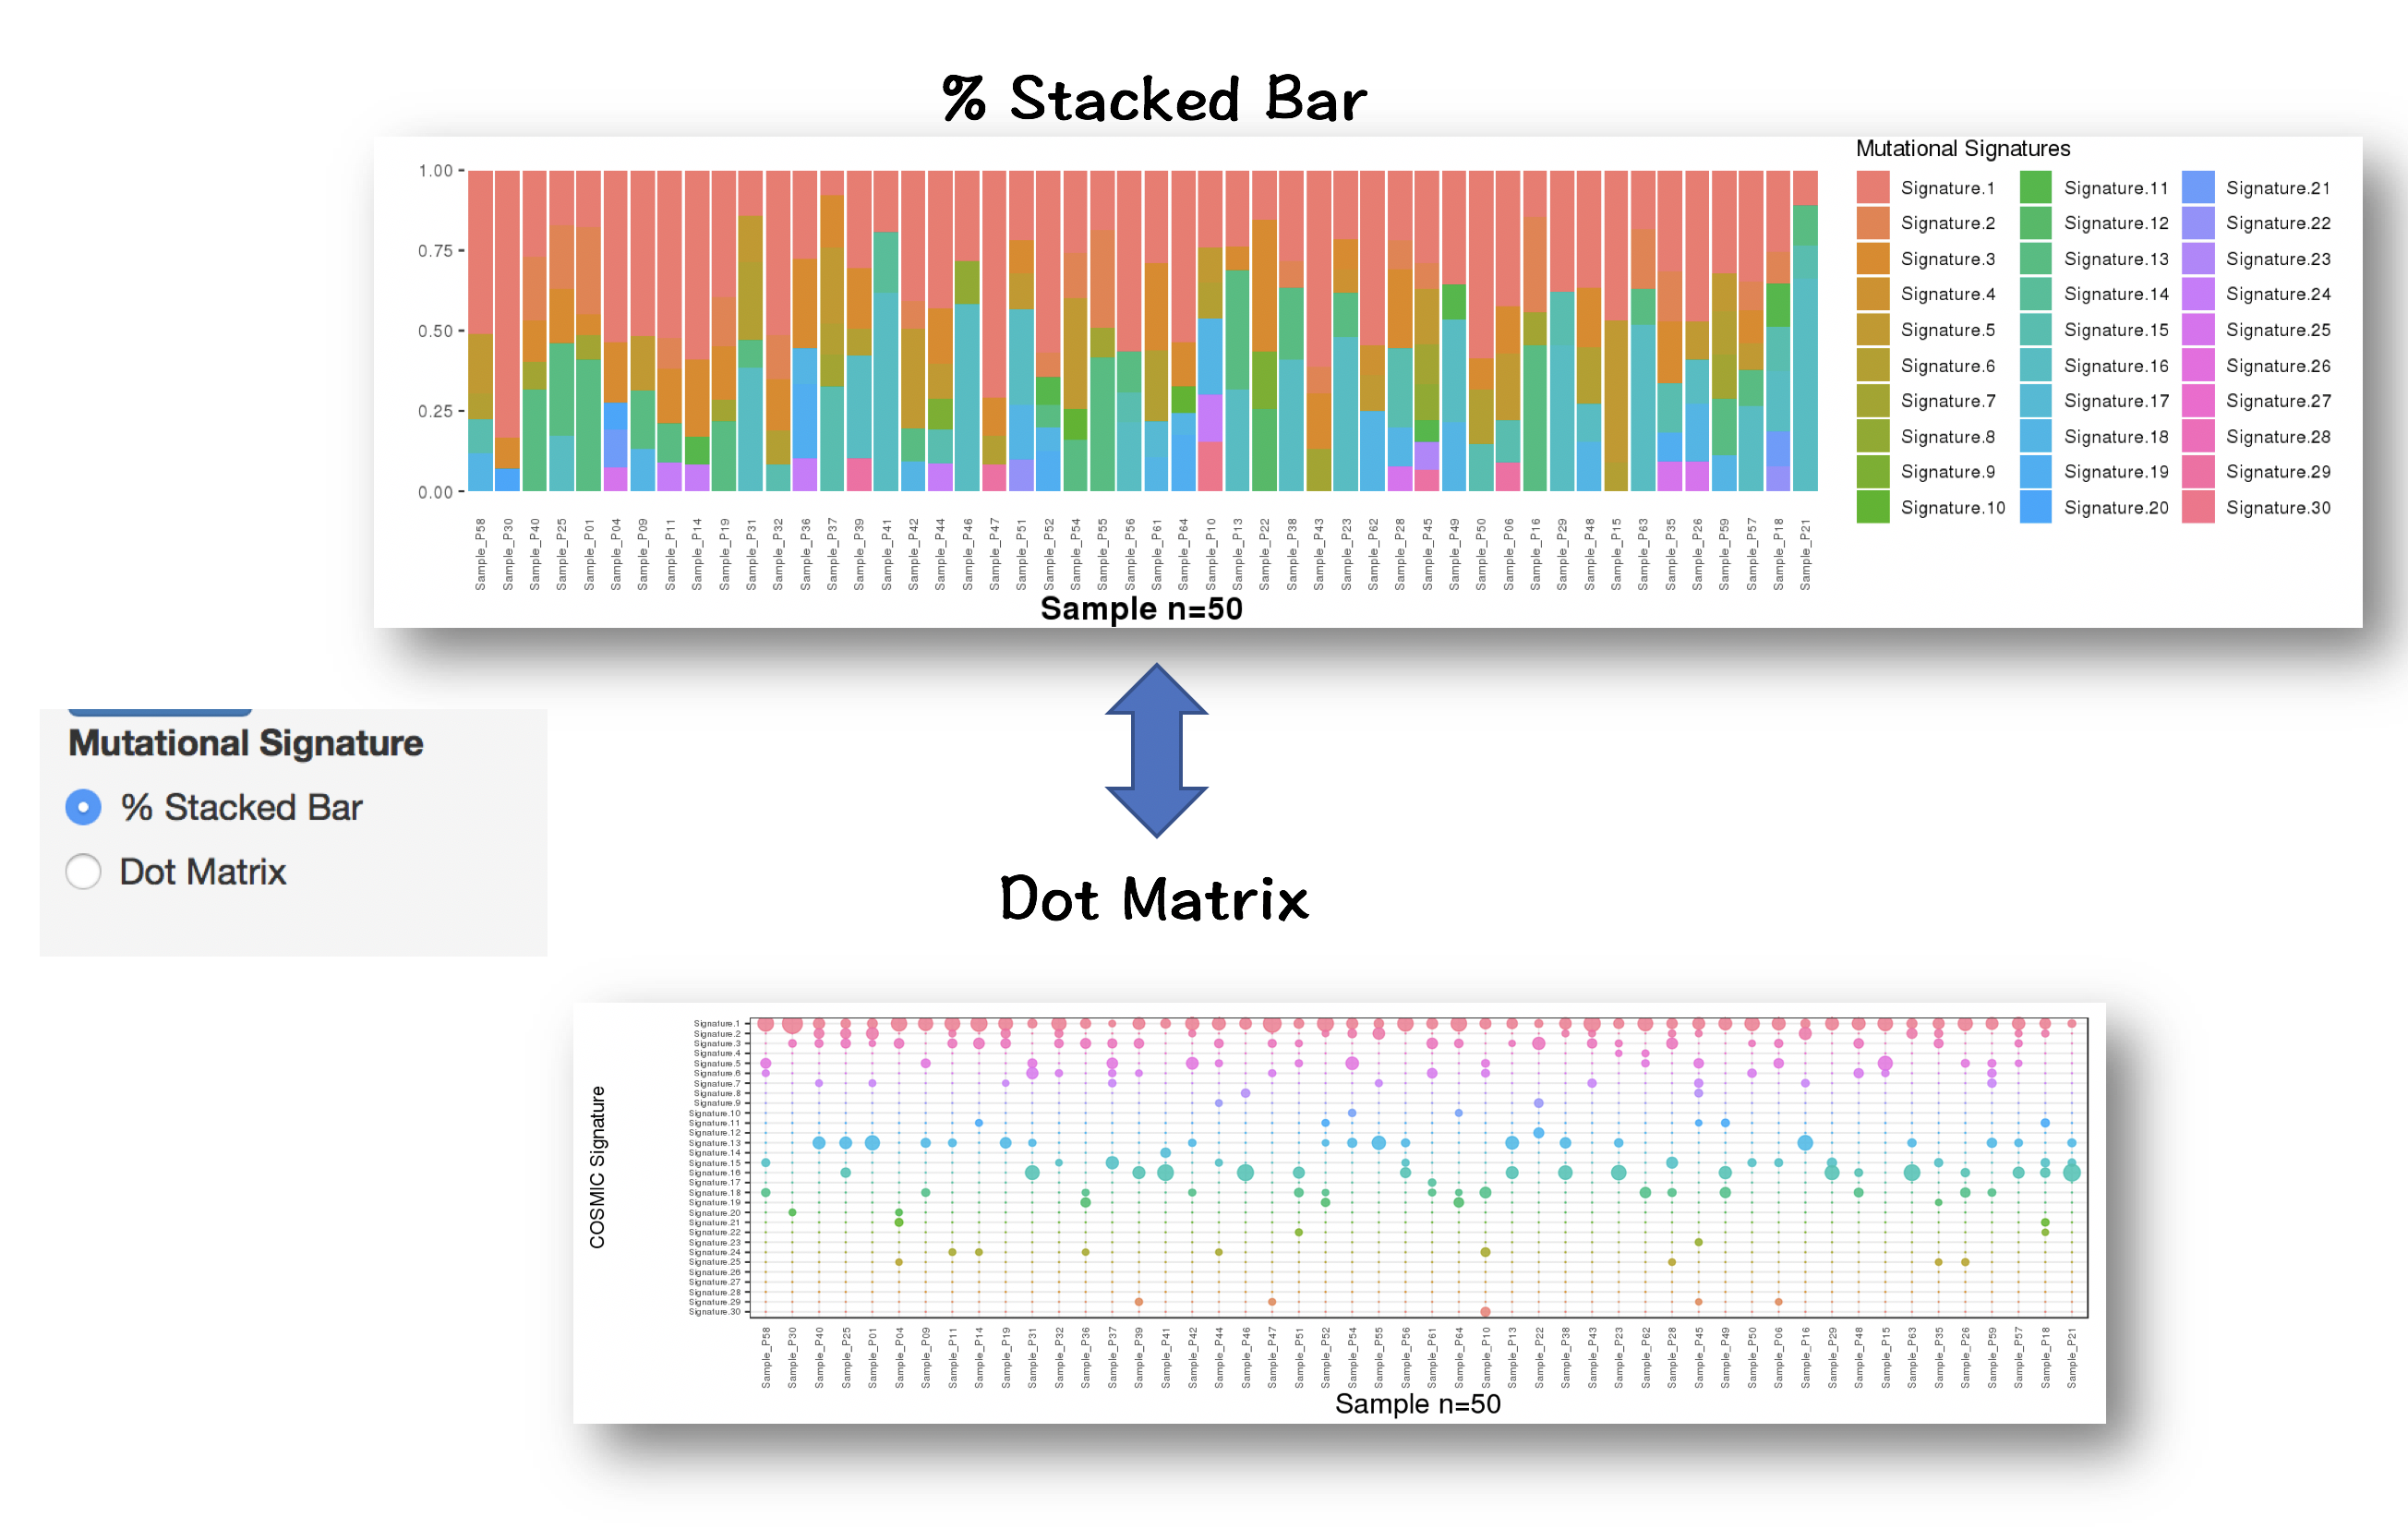
2.4.2.3 Inspecting contributions of mutational signatures in individual samples
Contributions of known mutational signatures (https://cancer.sanger.ac.uk/cosmic/signatures) in individual samples were quantified by using deconstructSigs packages.
Percentage stacked bar is a commonly used method for displaying the contributions of mutational signatures in each sample. However, users may find it very difficult to distinguish signatures from each other when too many signatures were identified in a sample.
To address this issue, we provide an alternative way to display the contributions of mutational signatures using dot matrix. As shown in the following figure, users can easily depict the landscape of mutational signatures across samples using dot matrix.
2.4.3 Cross-project comparison
The mutation profiles of 73 cancer projects (33 TCGA and 40 ICGC) were obtained from GDC Data Prota and [ICGC Data Portal] (https://dcc.icgc.org), respectively. The mutation profiles were pre-compiled to local indexed database of CoMutPlotter. We re-annotated all the mutation profiles using Oncotator 1.9.9.0 to makesure the analysis results are comparable.
The cancer project of interest can be selected through the drop-down list, which is sorted alphanumerically.

2.4.4 Download & Report Generatio