Chapter 3 Example of Use
As a proof-of-concept experiment, we applied CoMutPlotter to analyze our published datasets Nat Commun. 2017. 8(1):465, BMC Genomics. 2018; 19 (Suppl 2): 86, which contain 50 sets of whole-exome sequencing data from oral cancer patients in Taiwan. In this study cohort, 24,051 mutation events that correspond to 23,495 unique somatic mutations were identified and recorded in the MAF file, which can be downloaded through the following link: (http://tardis.cgu.edu.tw/comutplotter/oscc_50.maf.zip) . For cross-project comparison, the same analysis workflow was also applied to analyze 178 sets of whole-exome sequencing data from oral cancer patients in India Nat Commun. 2013;4:2873, which can be downloaded from the ICGC Data Portal through the following link: (https://dcc.icgc.org/api/v1/download?fn=/release_27/Projects/ORCA-IN/simple_somatic_mutation.open.ORCA-IN.tsv.gz)
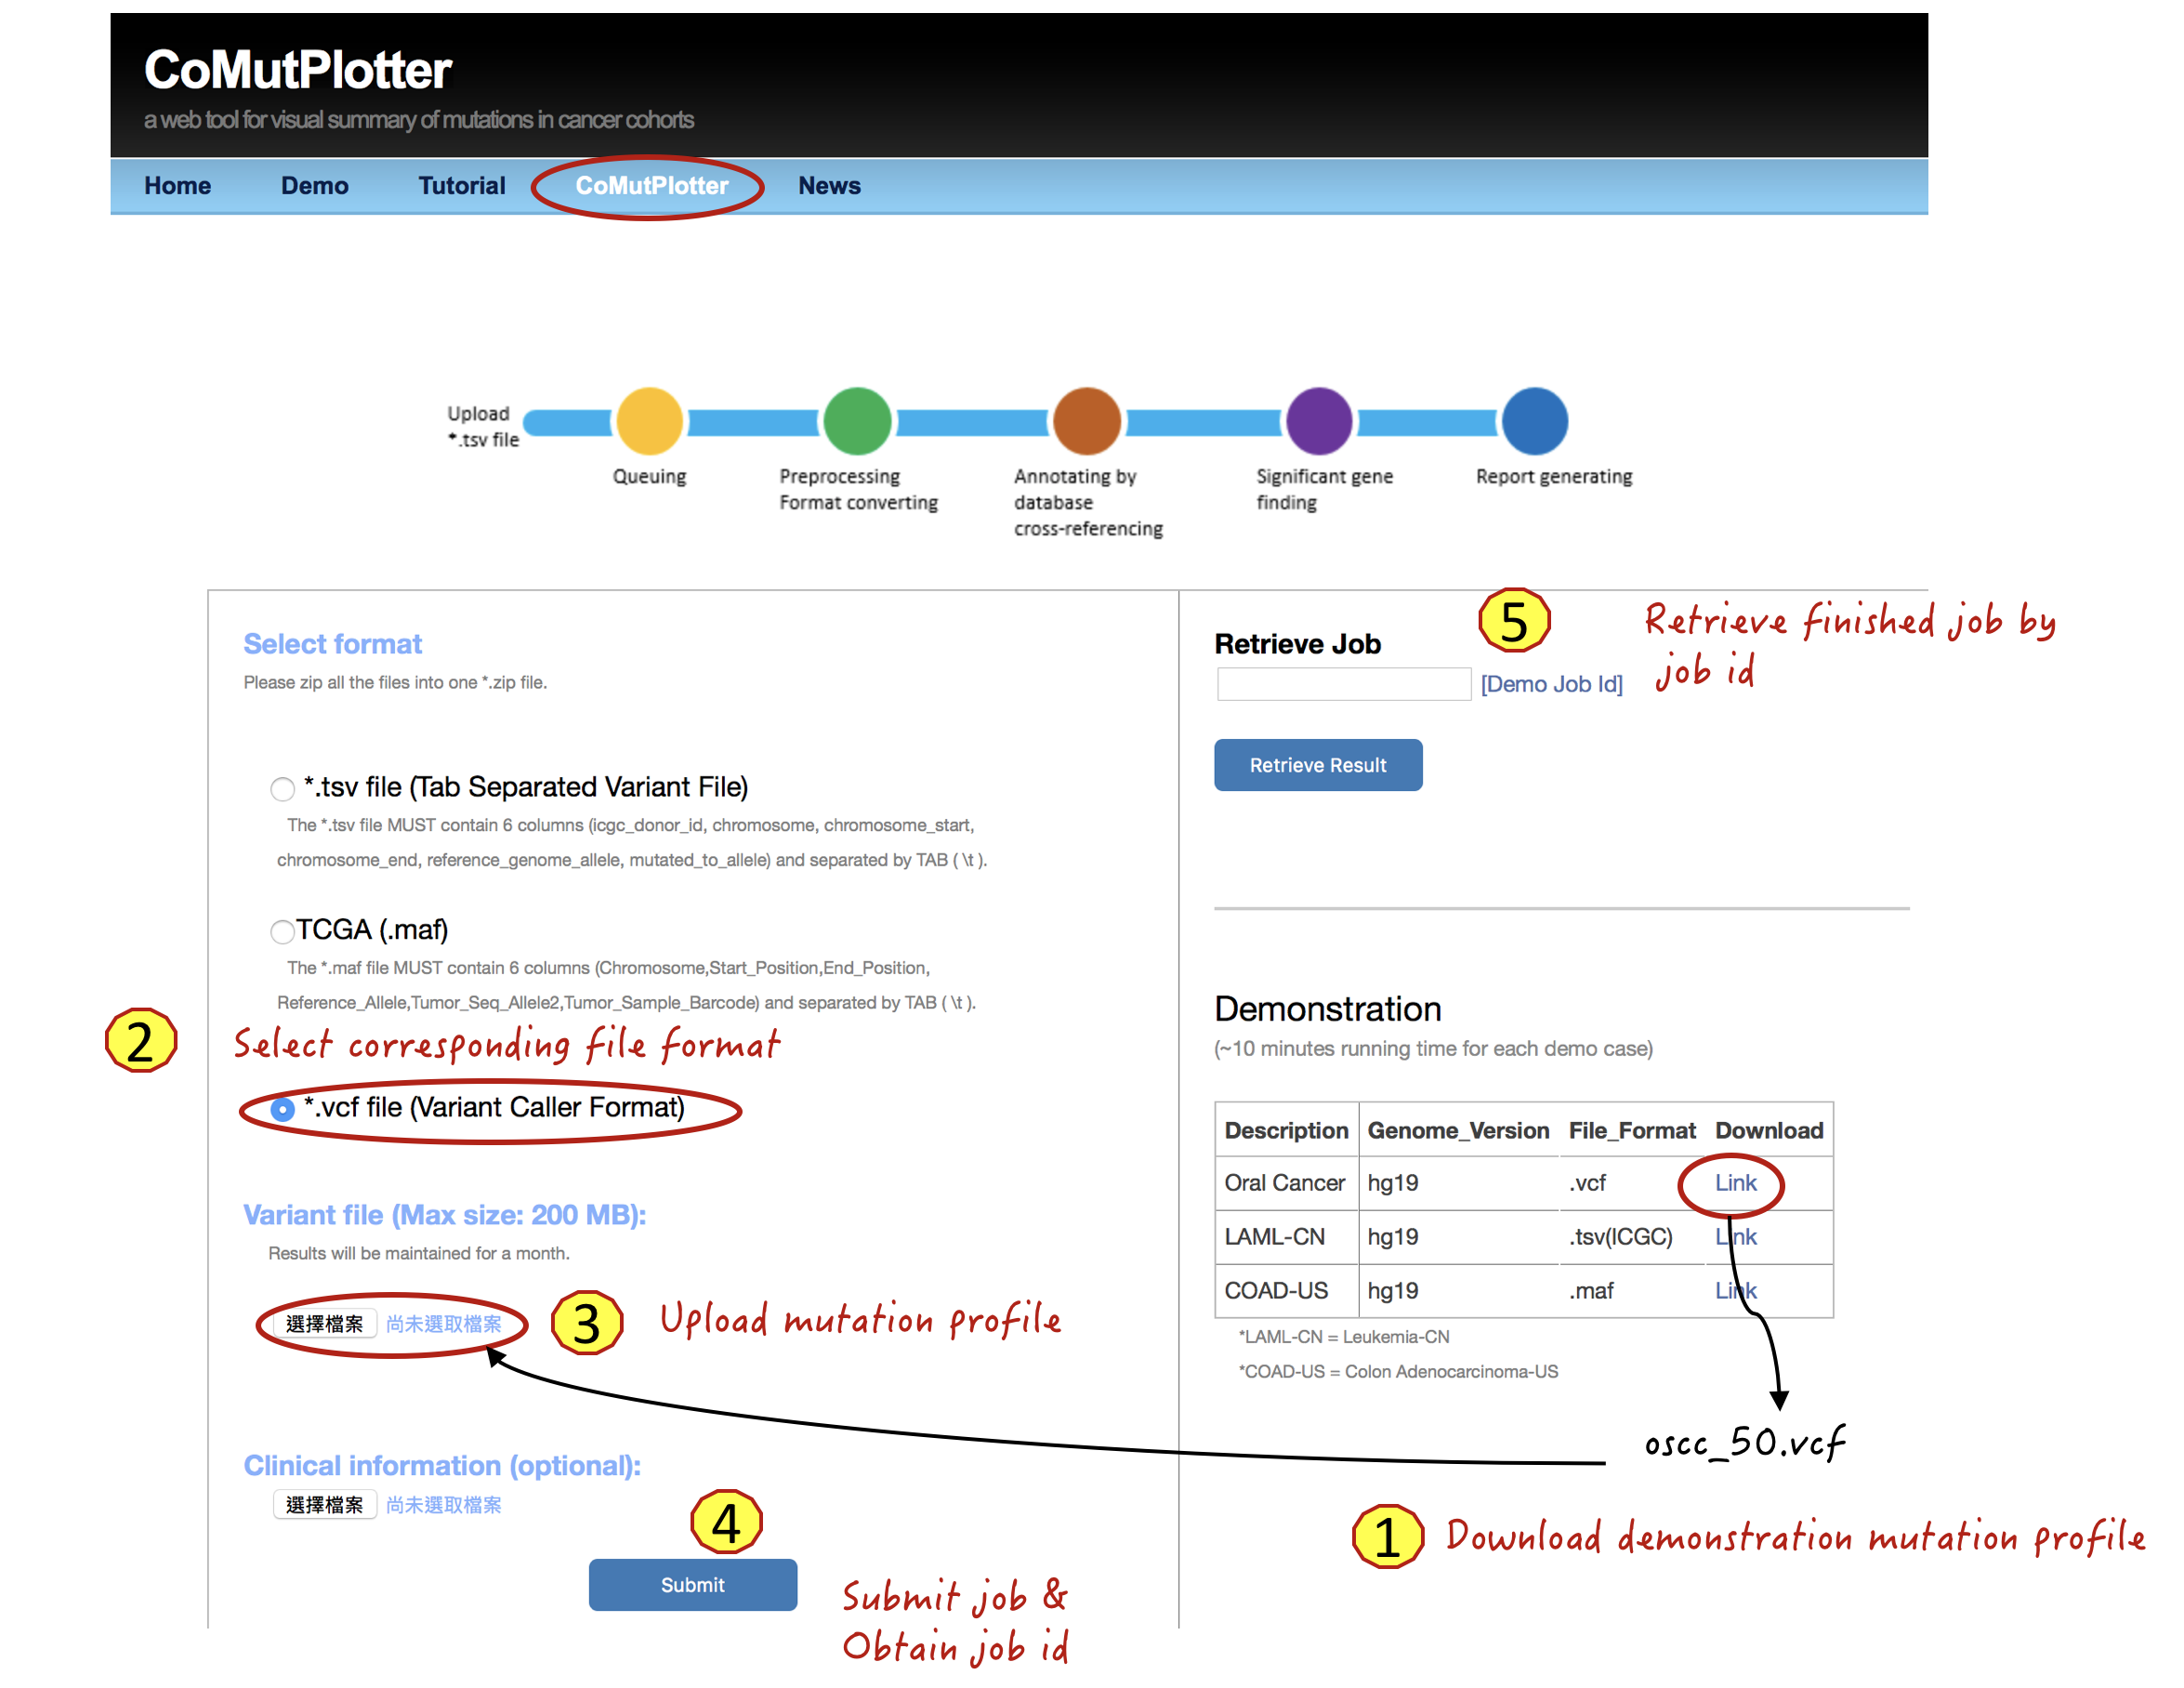
3.1 Upload mutation profile
Steps:
- Download demonstration mutation profile of 50 Oral cancer datasets
- Select corresponding file format
- Upload the mutation profile
- Press the Submit button and obtain job identifier for future inspection
- Retrieve finished job by job identifier
3.2 Output of CoMutPlotter
The output of CoMutPlotter consists of three major components:
1. CoMut Plot
2. Cross-project comparison
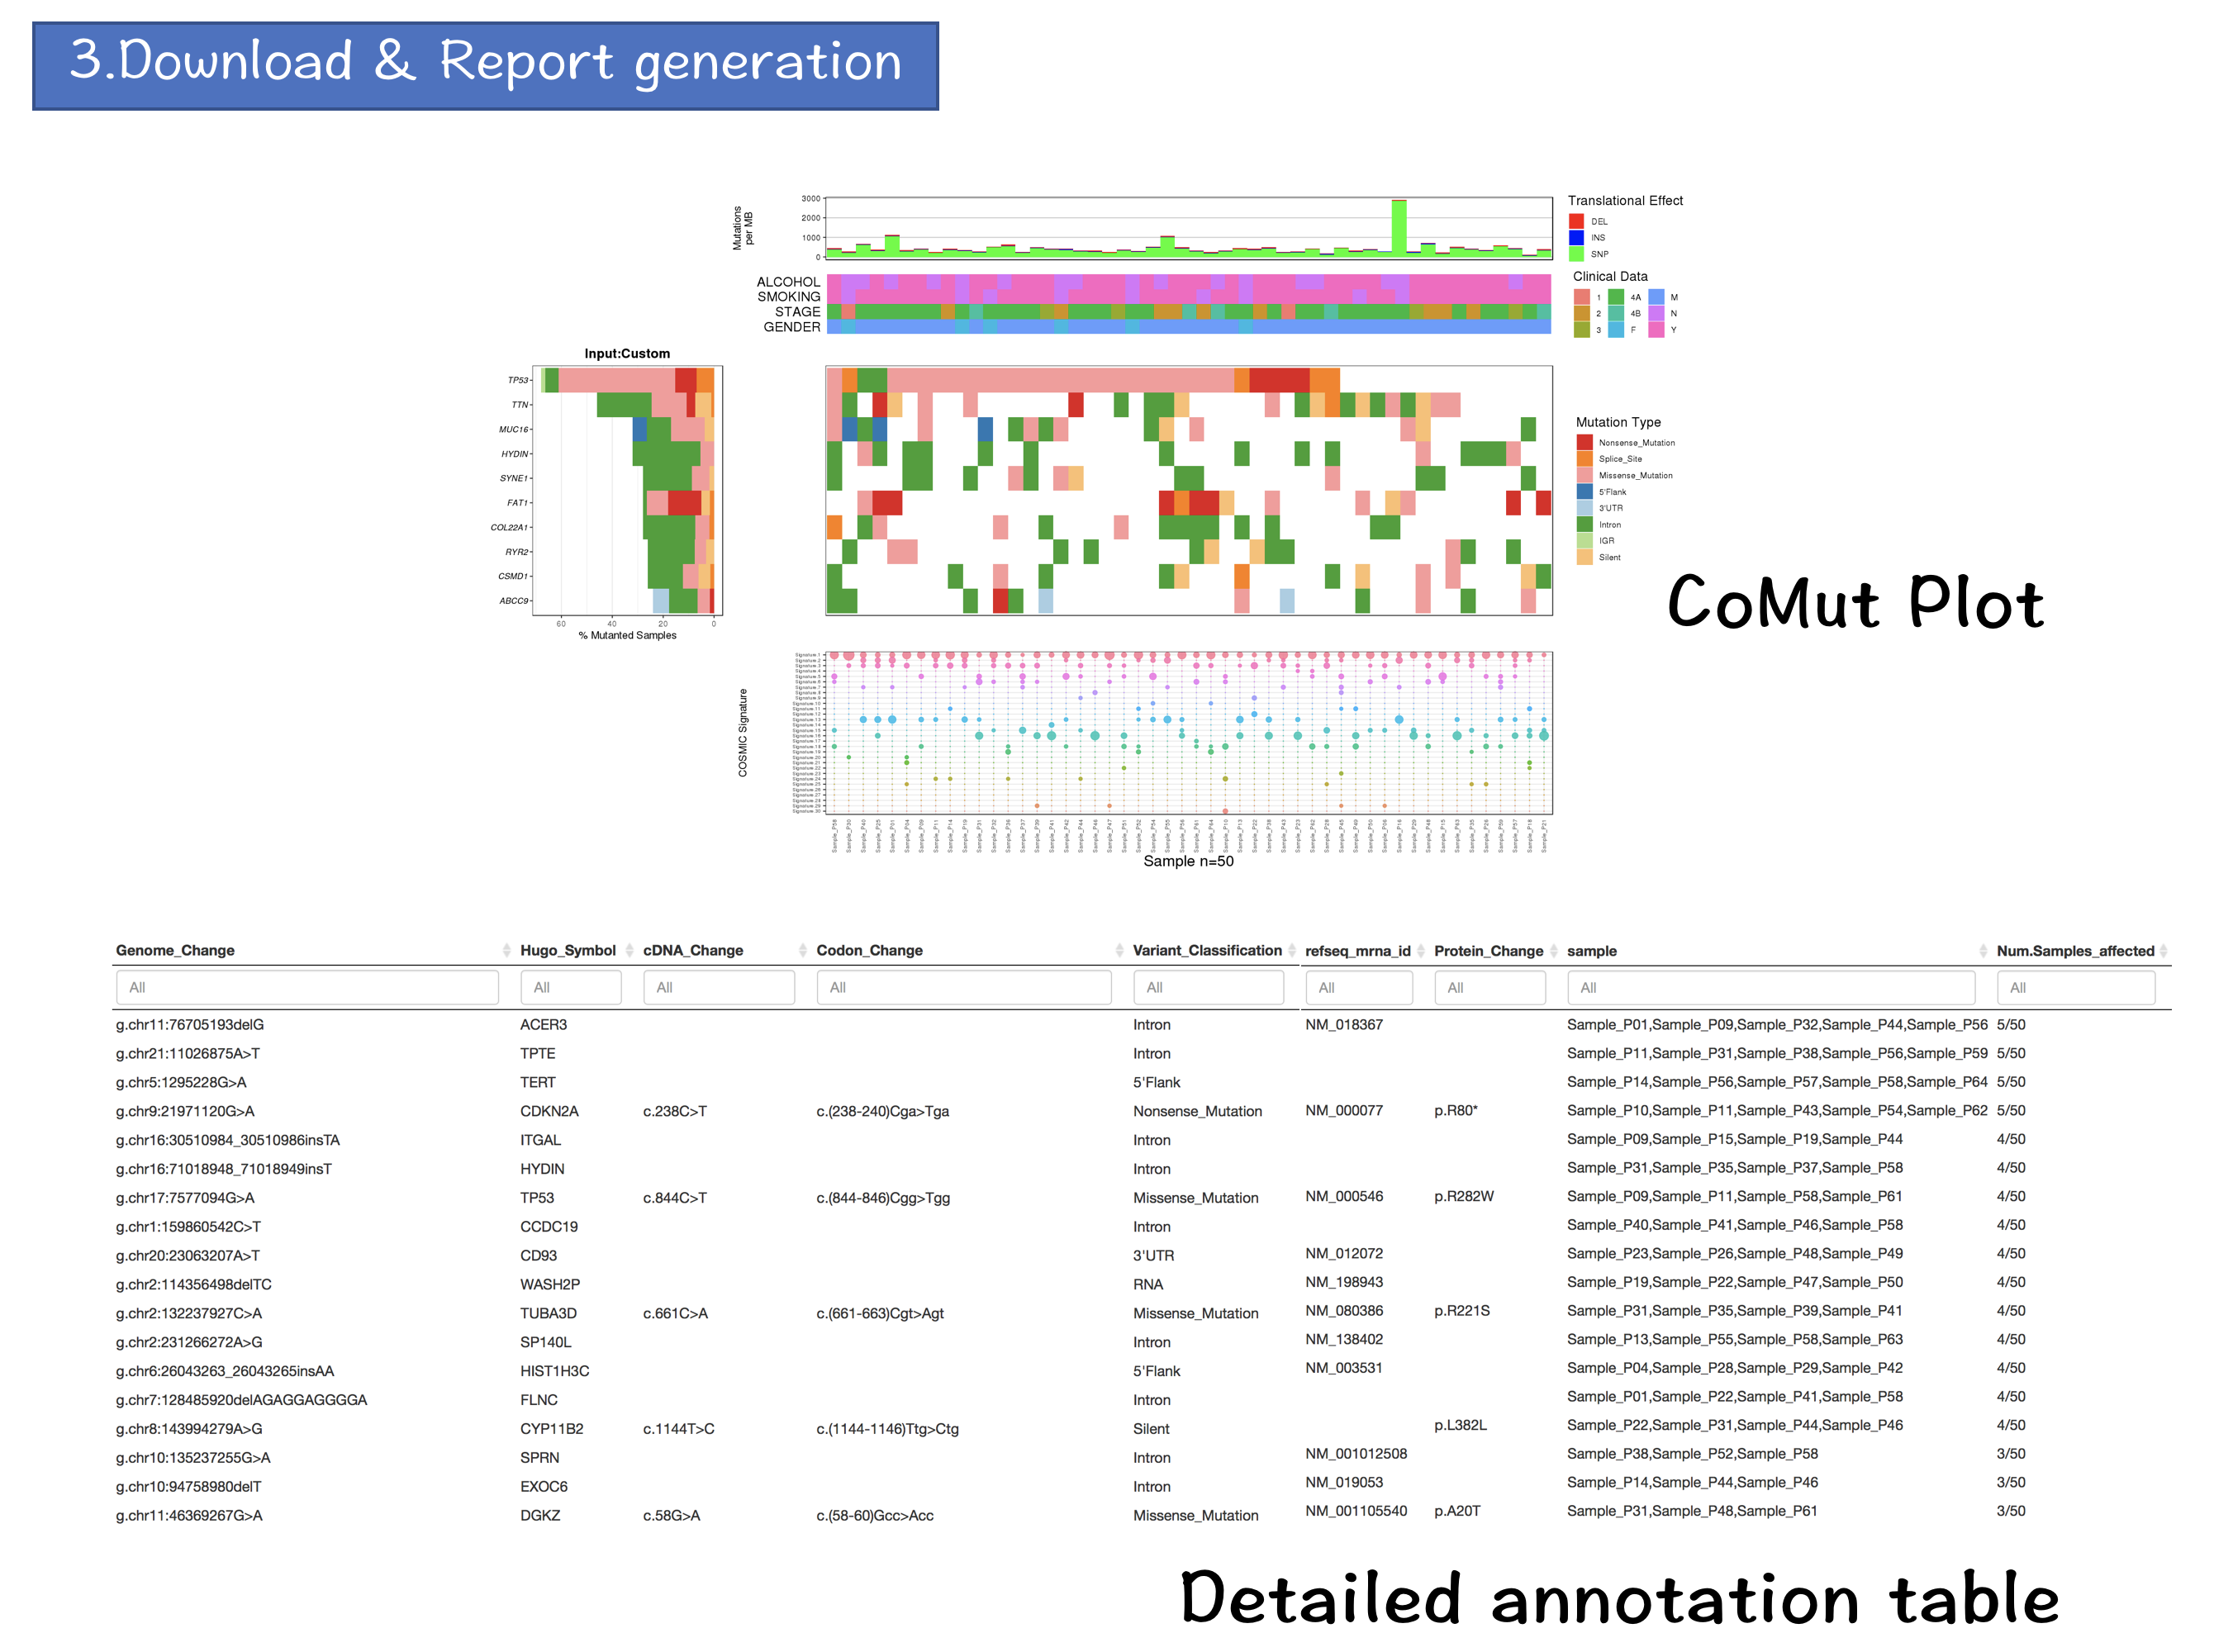
3. Download & Report Generation
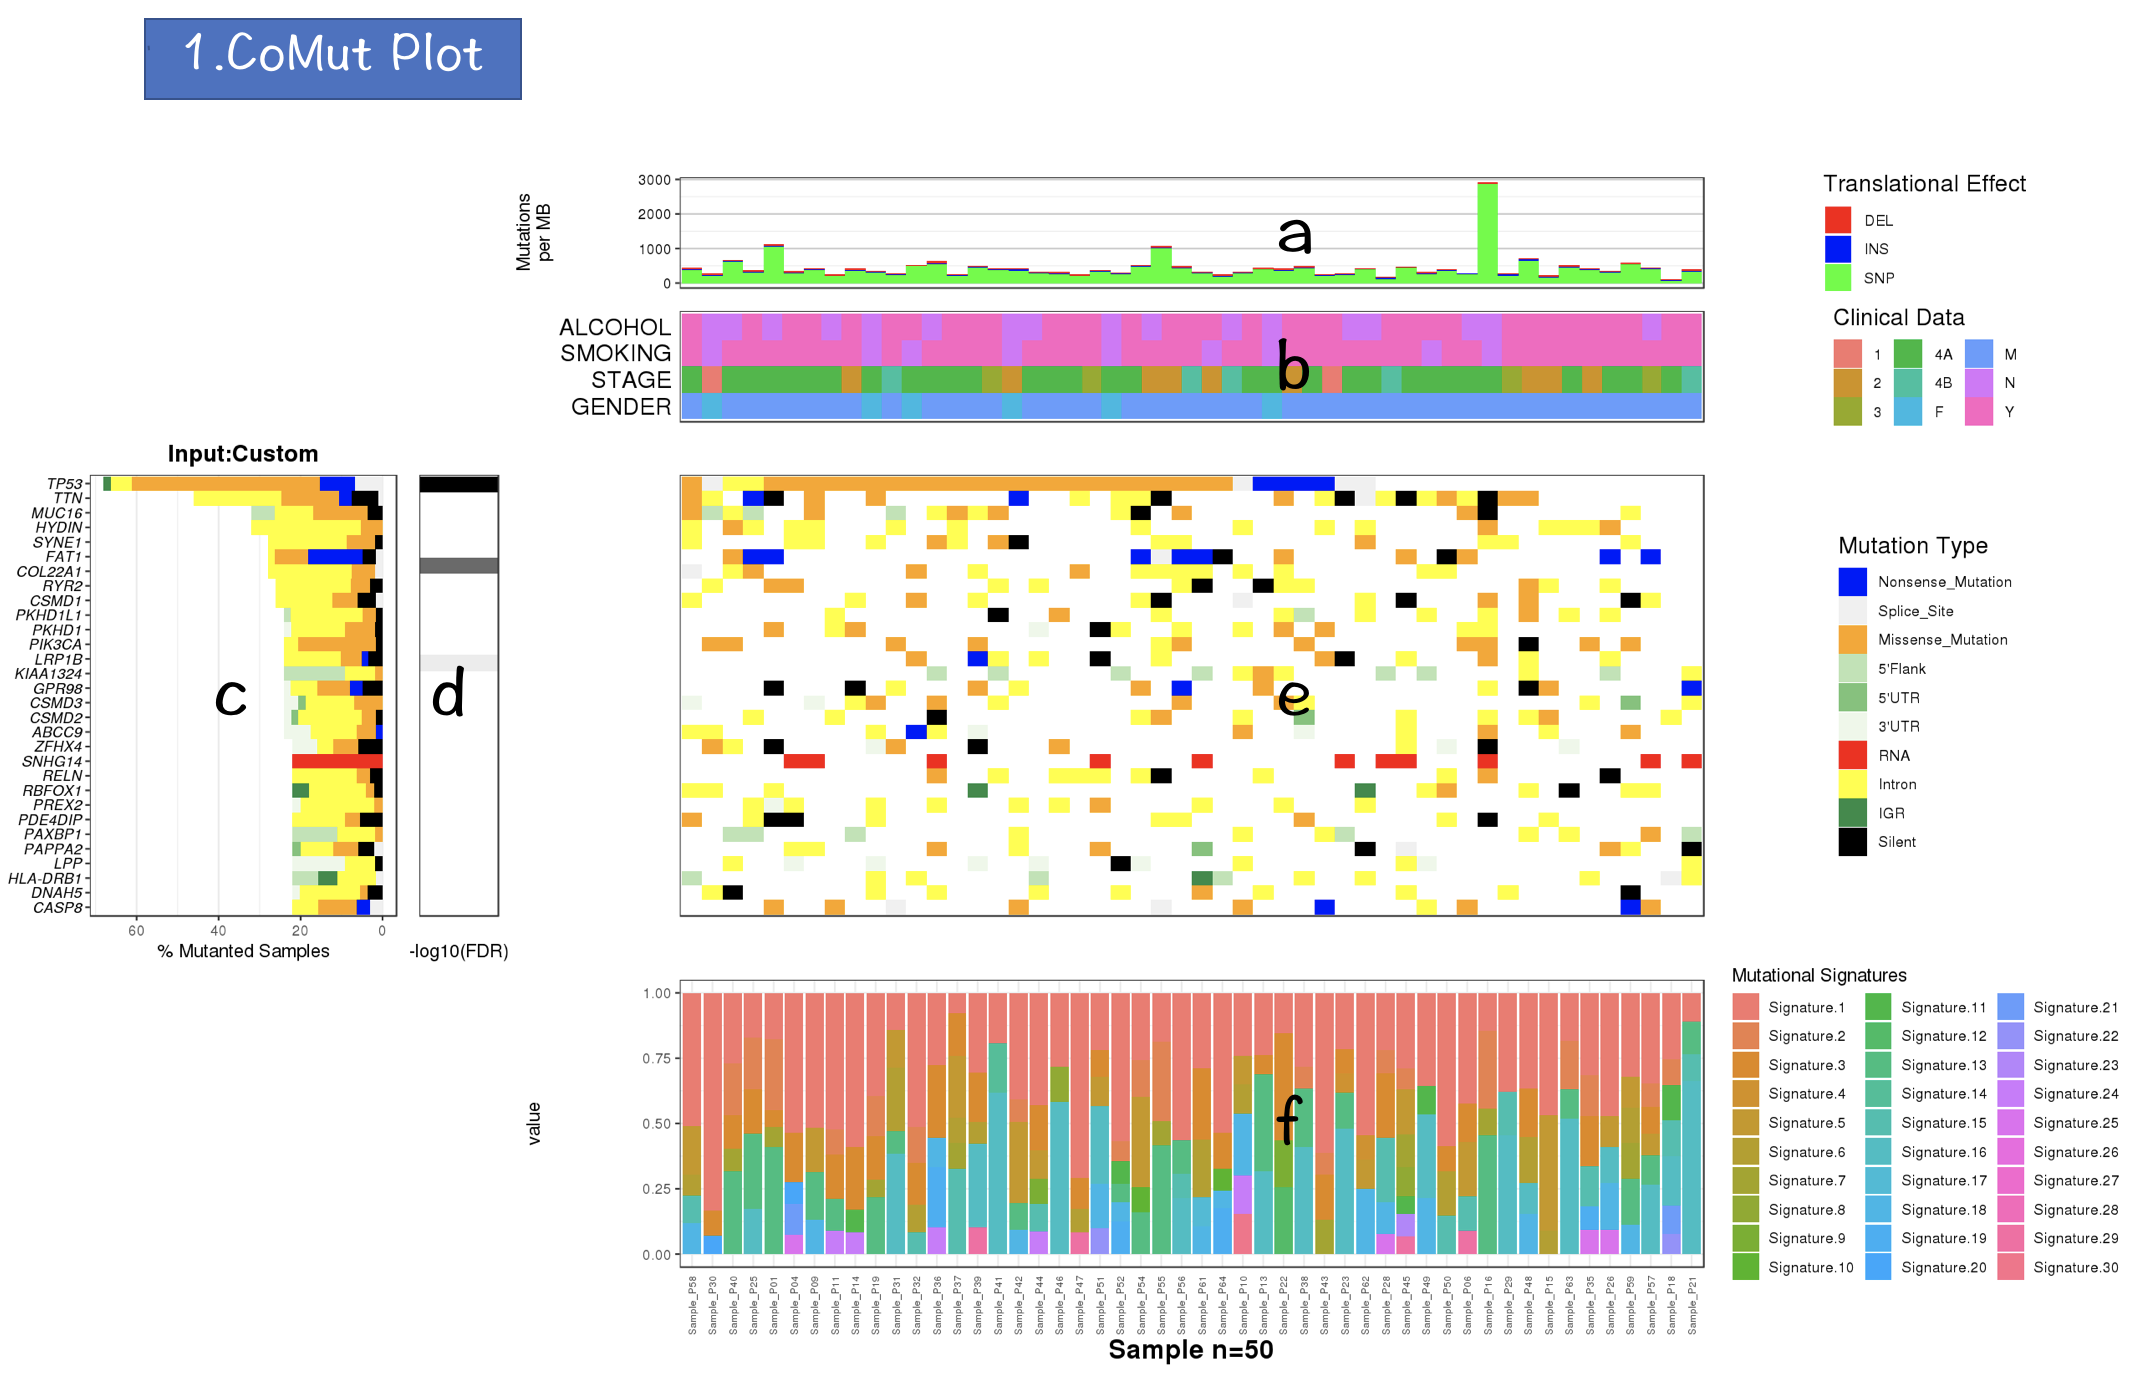
3.2.1 CoMut Plot
- Mutation rate per sample stratified by tanslational effects such as SNPs, Insertions and Deletions
The mutation rate is calculated as number of somatic mutations per million bases. - Sample metadata is displayed as heatmap
- Gene mutation is displayed as bar plot and stratified by various mutation types
- Significantly mutated genes identified by MutSigCV by FDR (q) <=0.1
The color gradient is rendered according to -log10(FDR)
- Mutation landscape and effects are displayed as heatmap
- Contributions of 30 COSMIC signatures in individual samples are displayed using % stacked bar chart
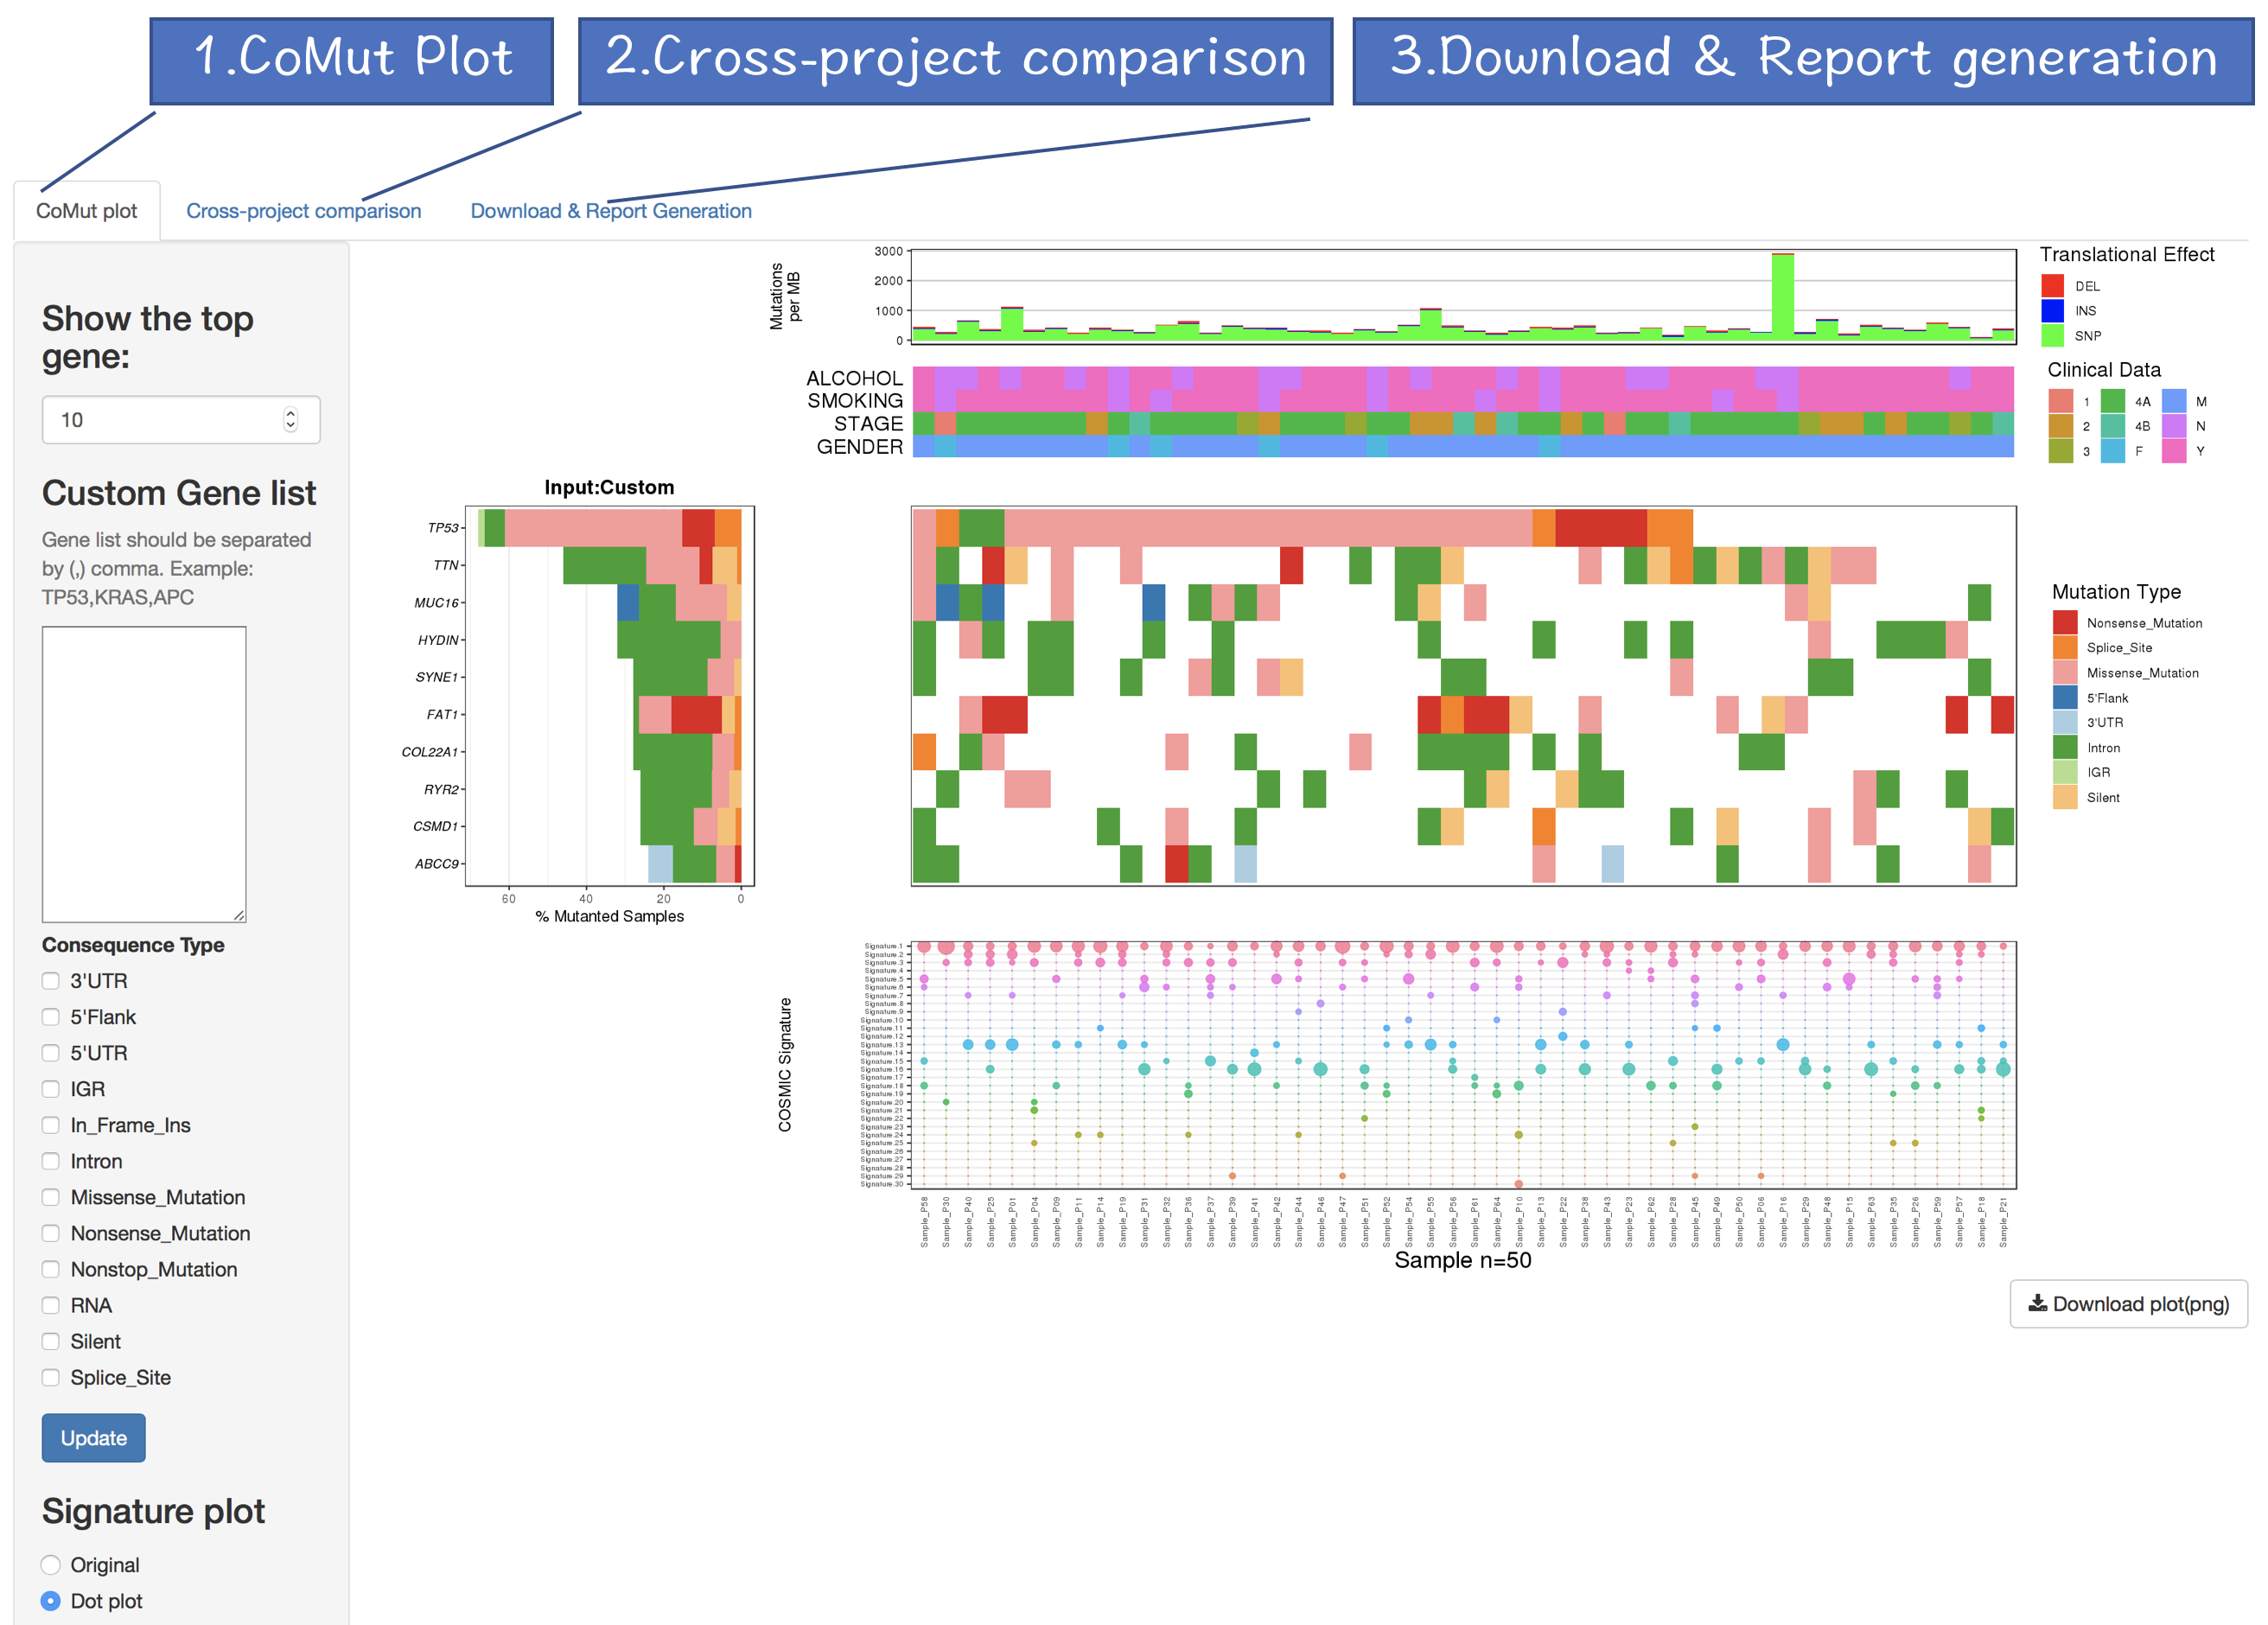
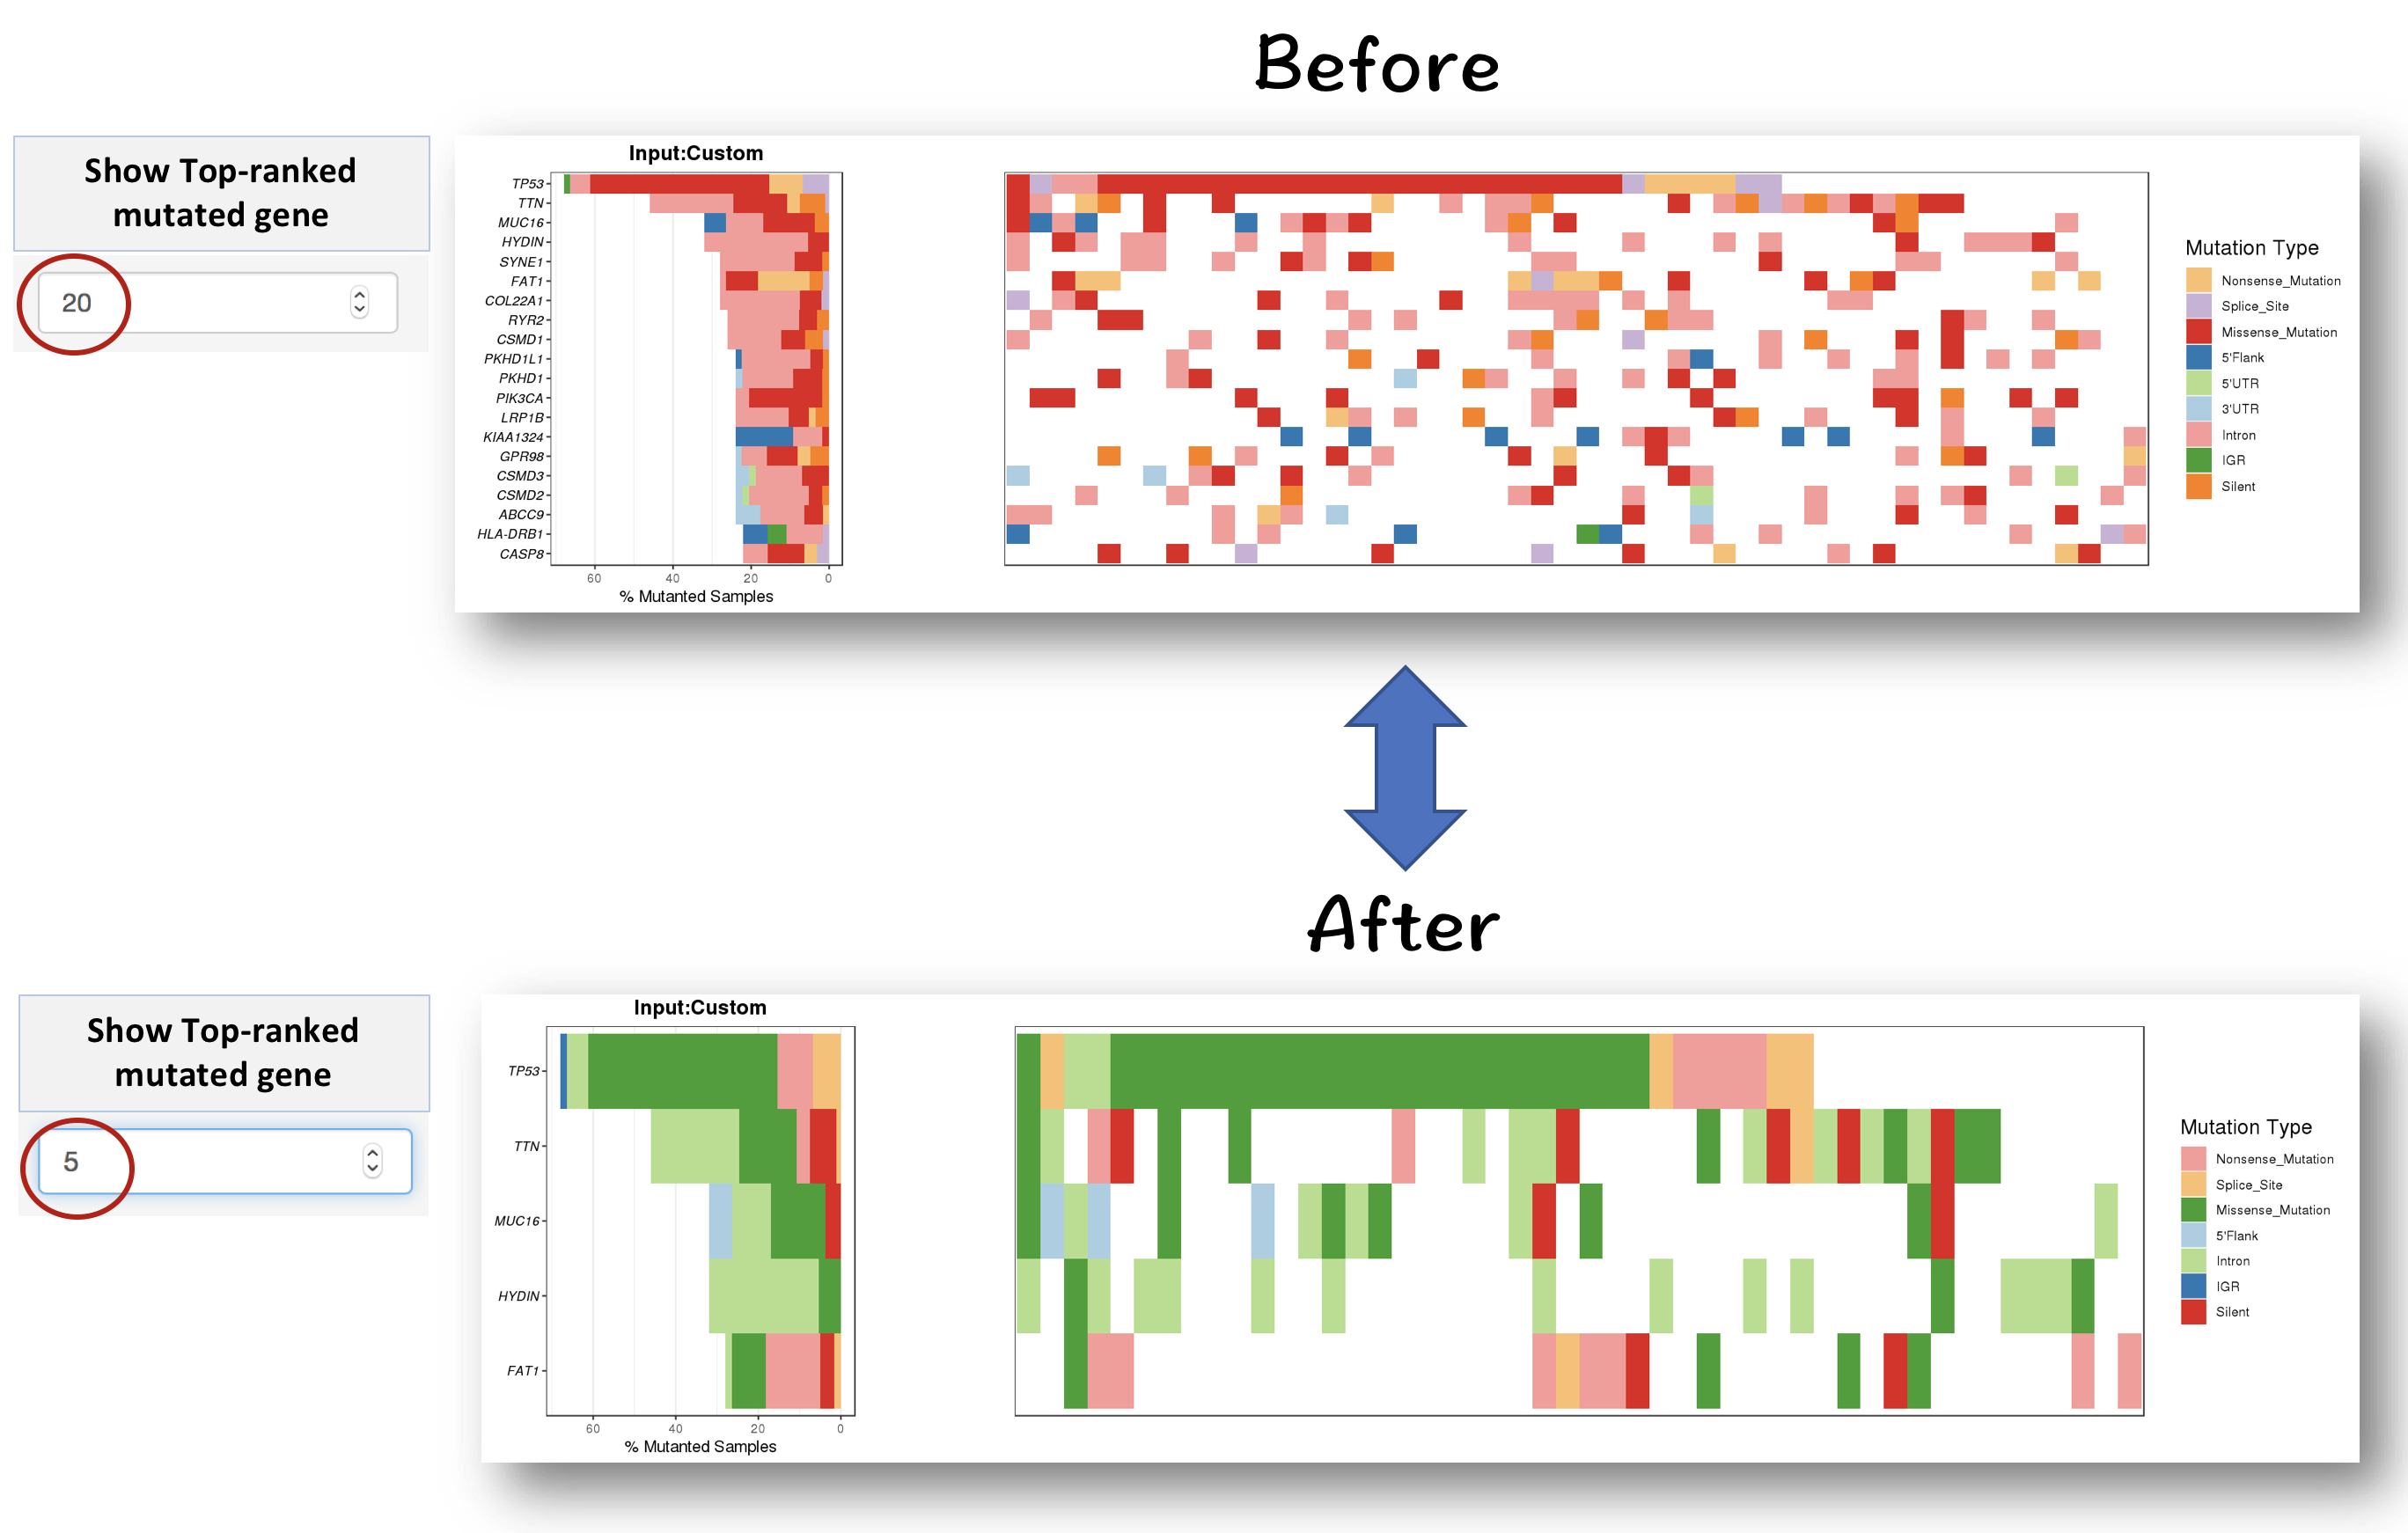
3.2.2 Interactive filters
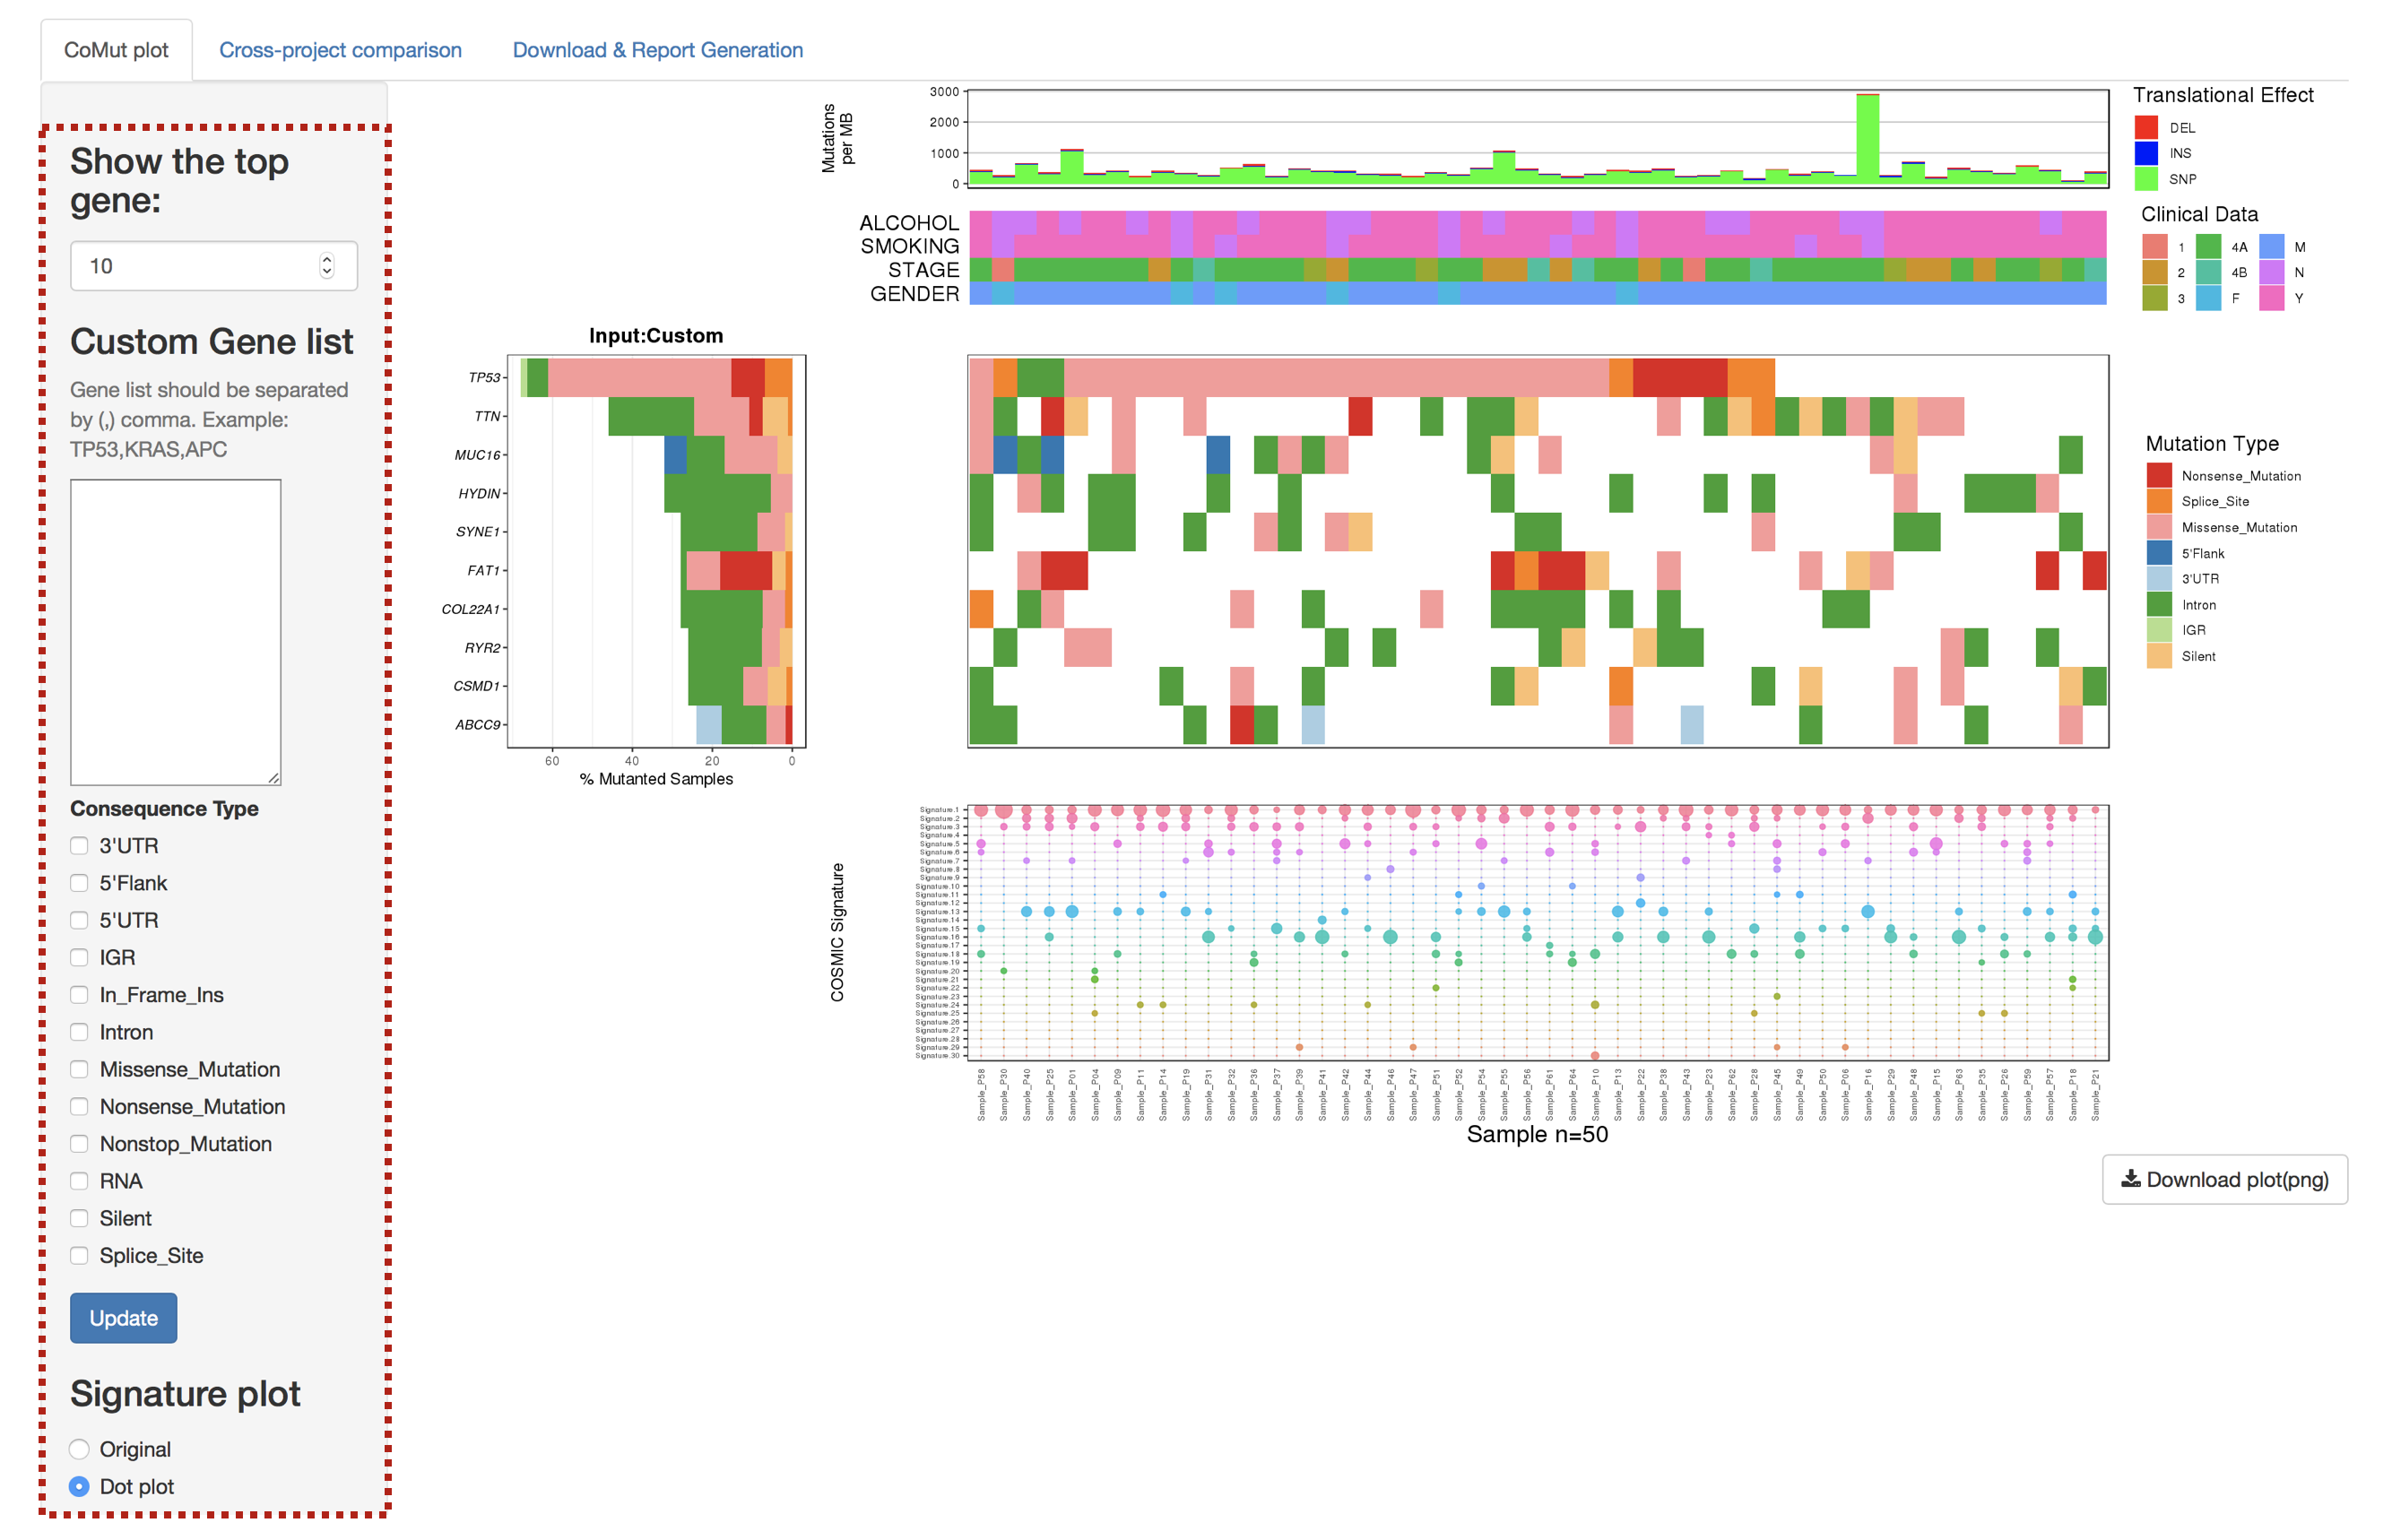
3.2.2.0.1 Filter for displaying the most frequently mutated genes
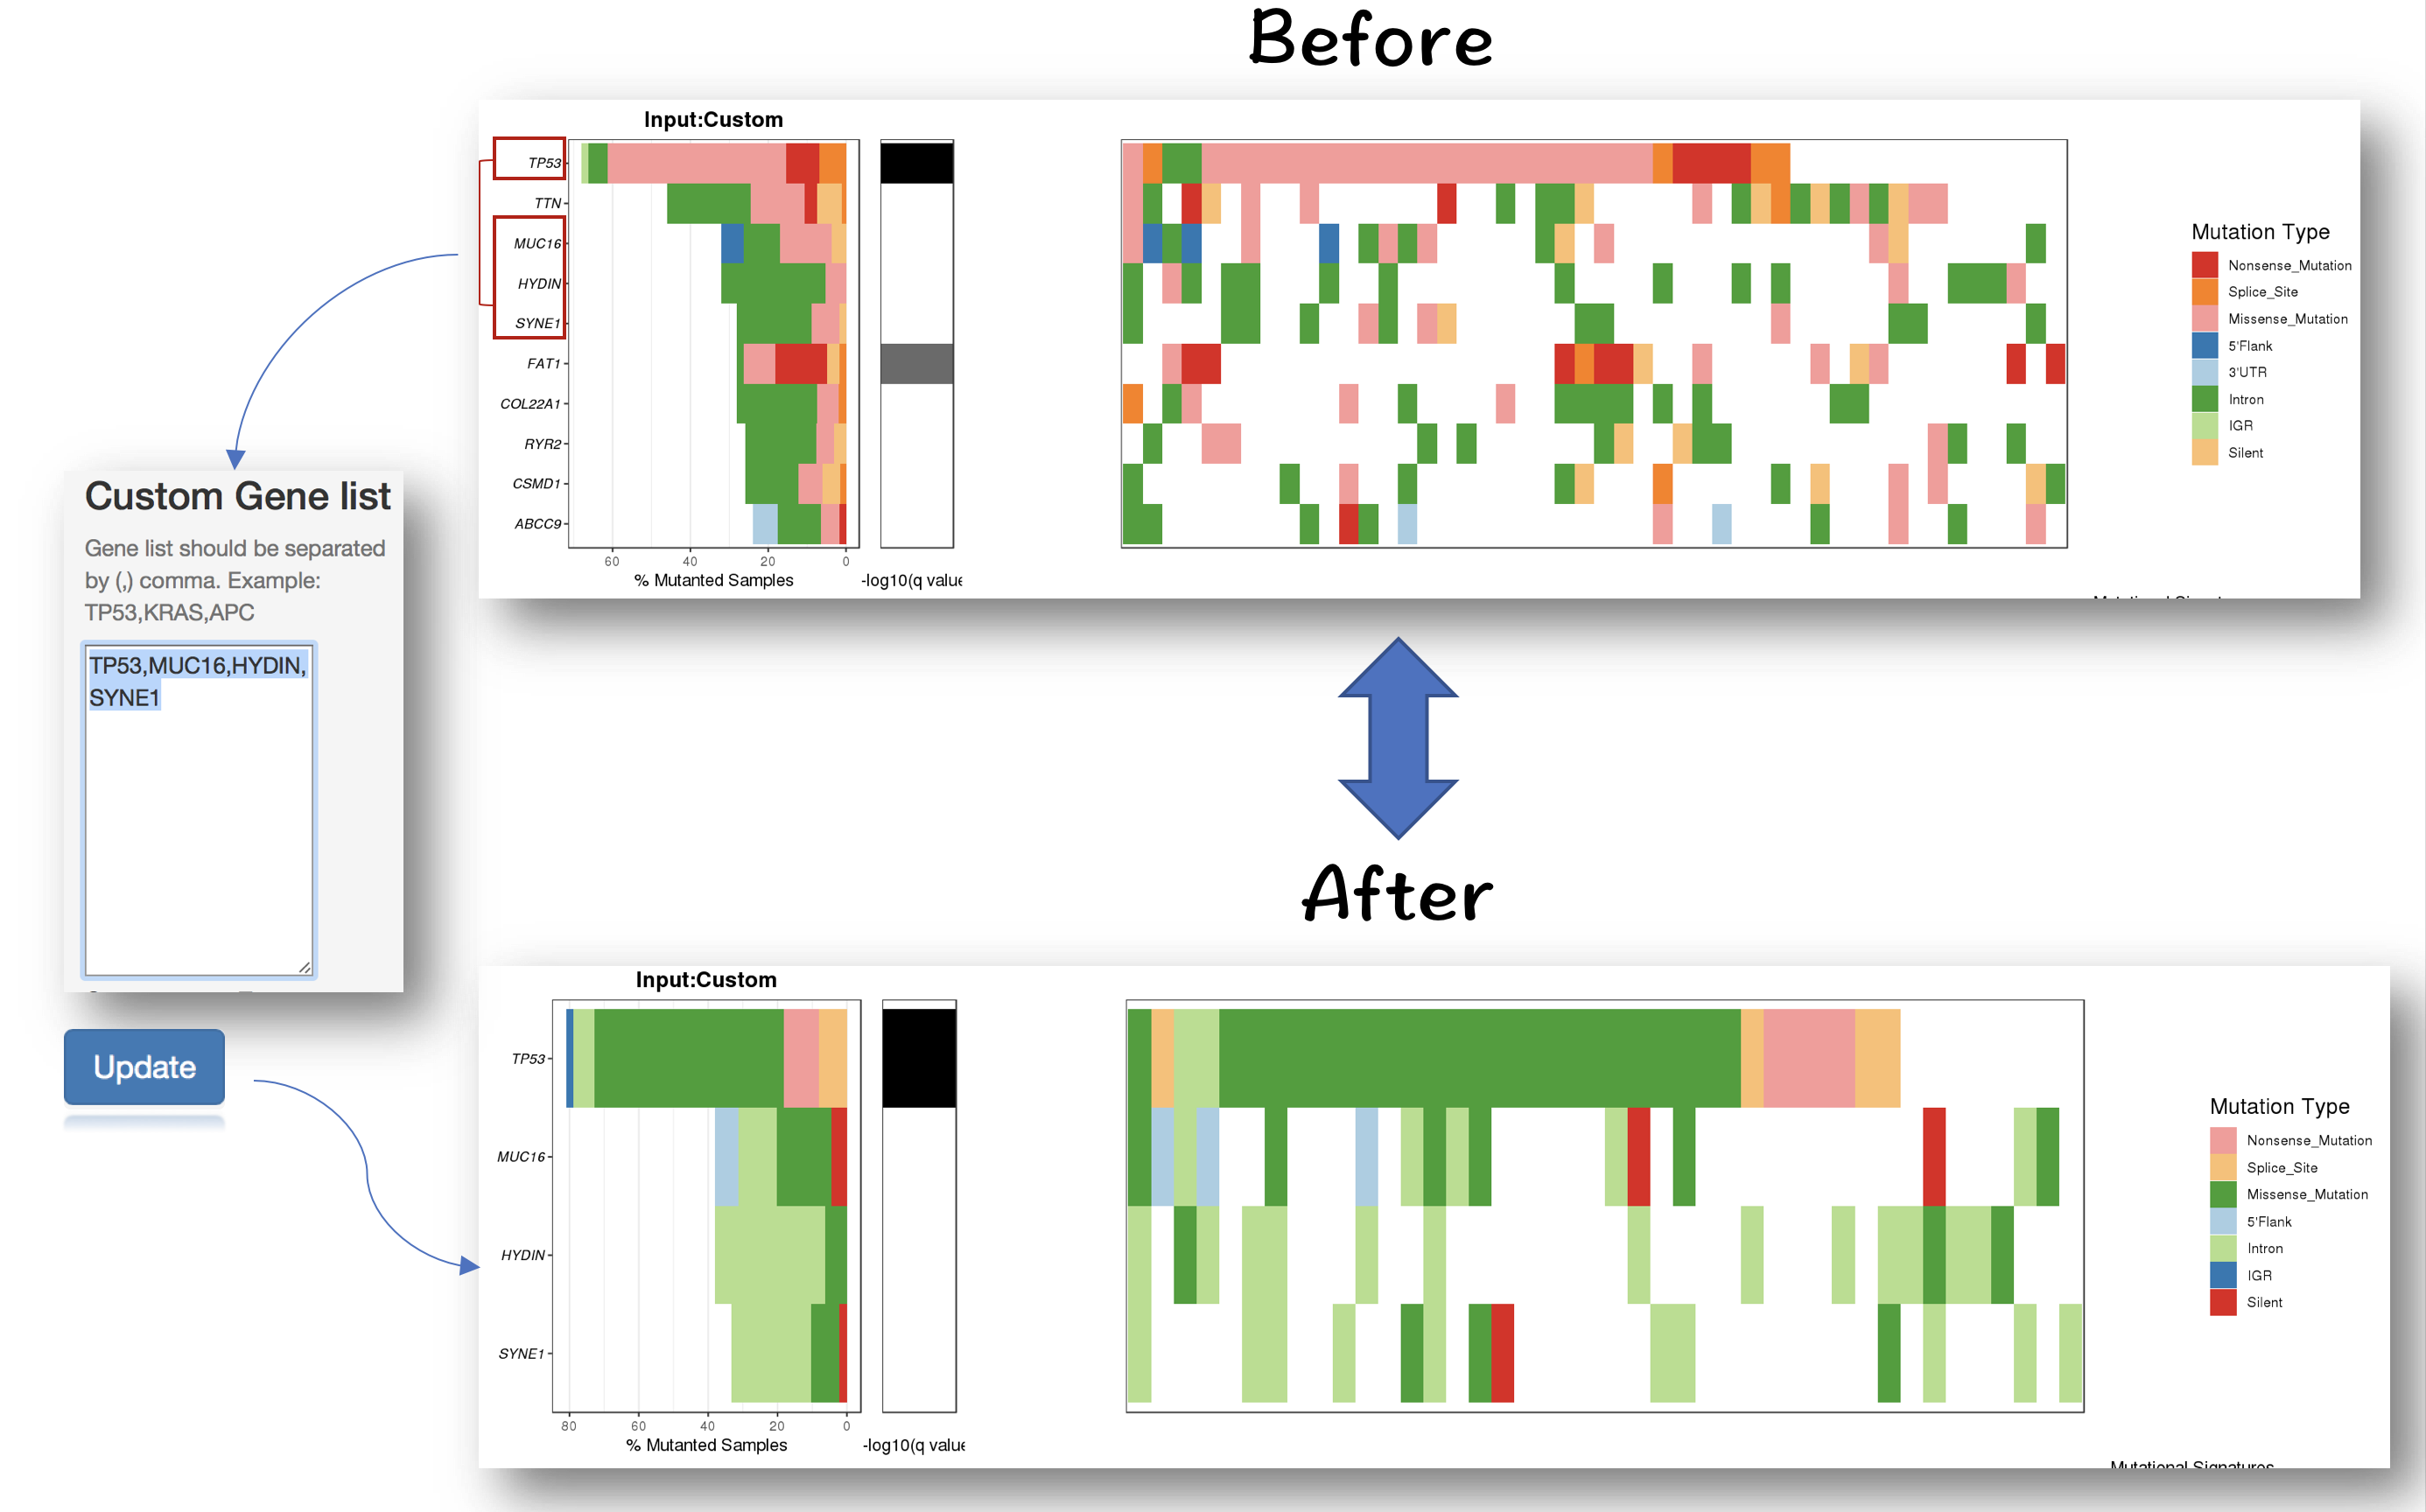
3.2.2.1 Filter for selecting genes of interest
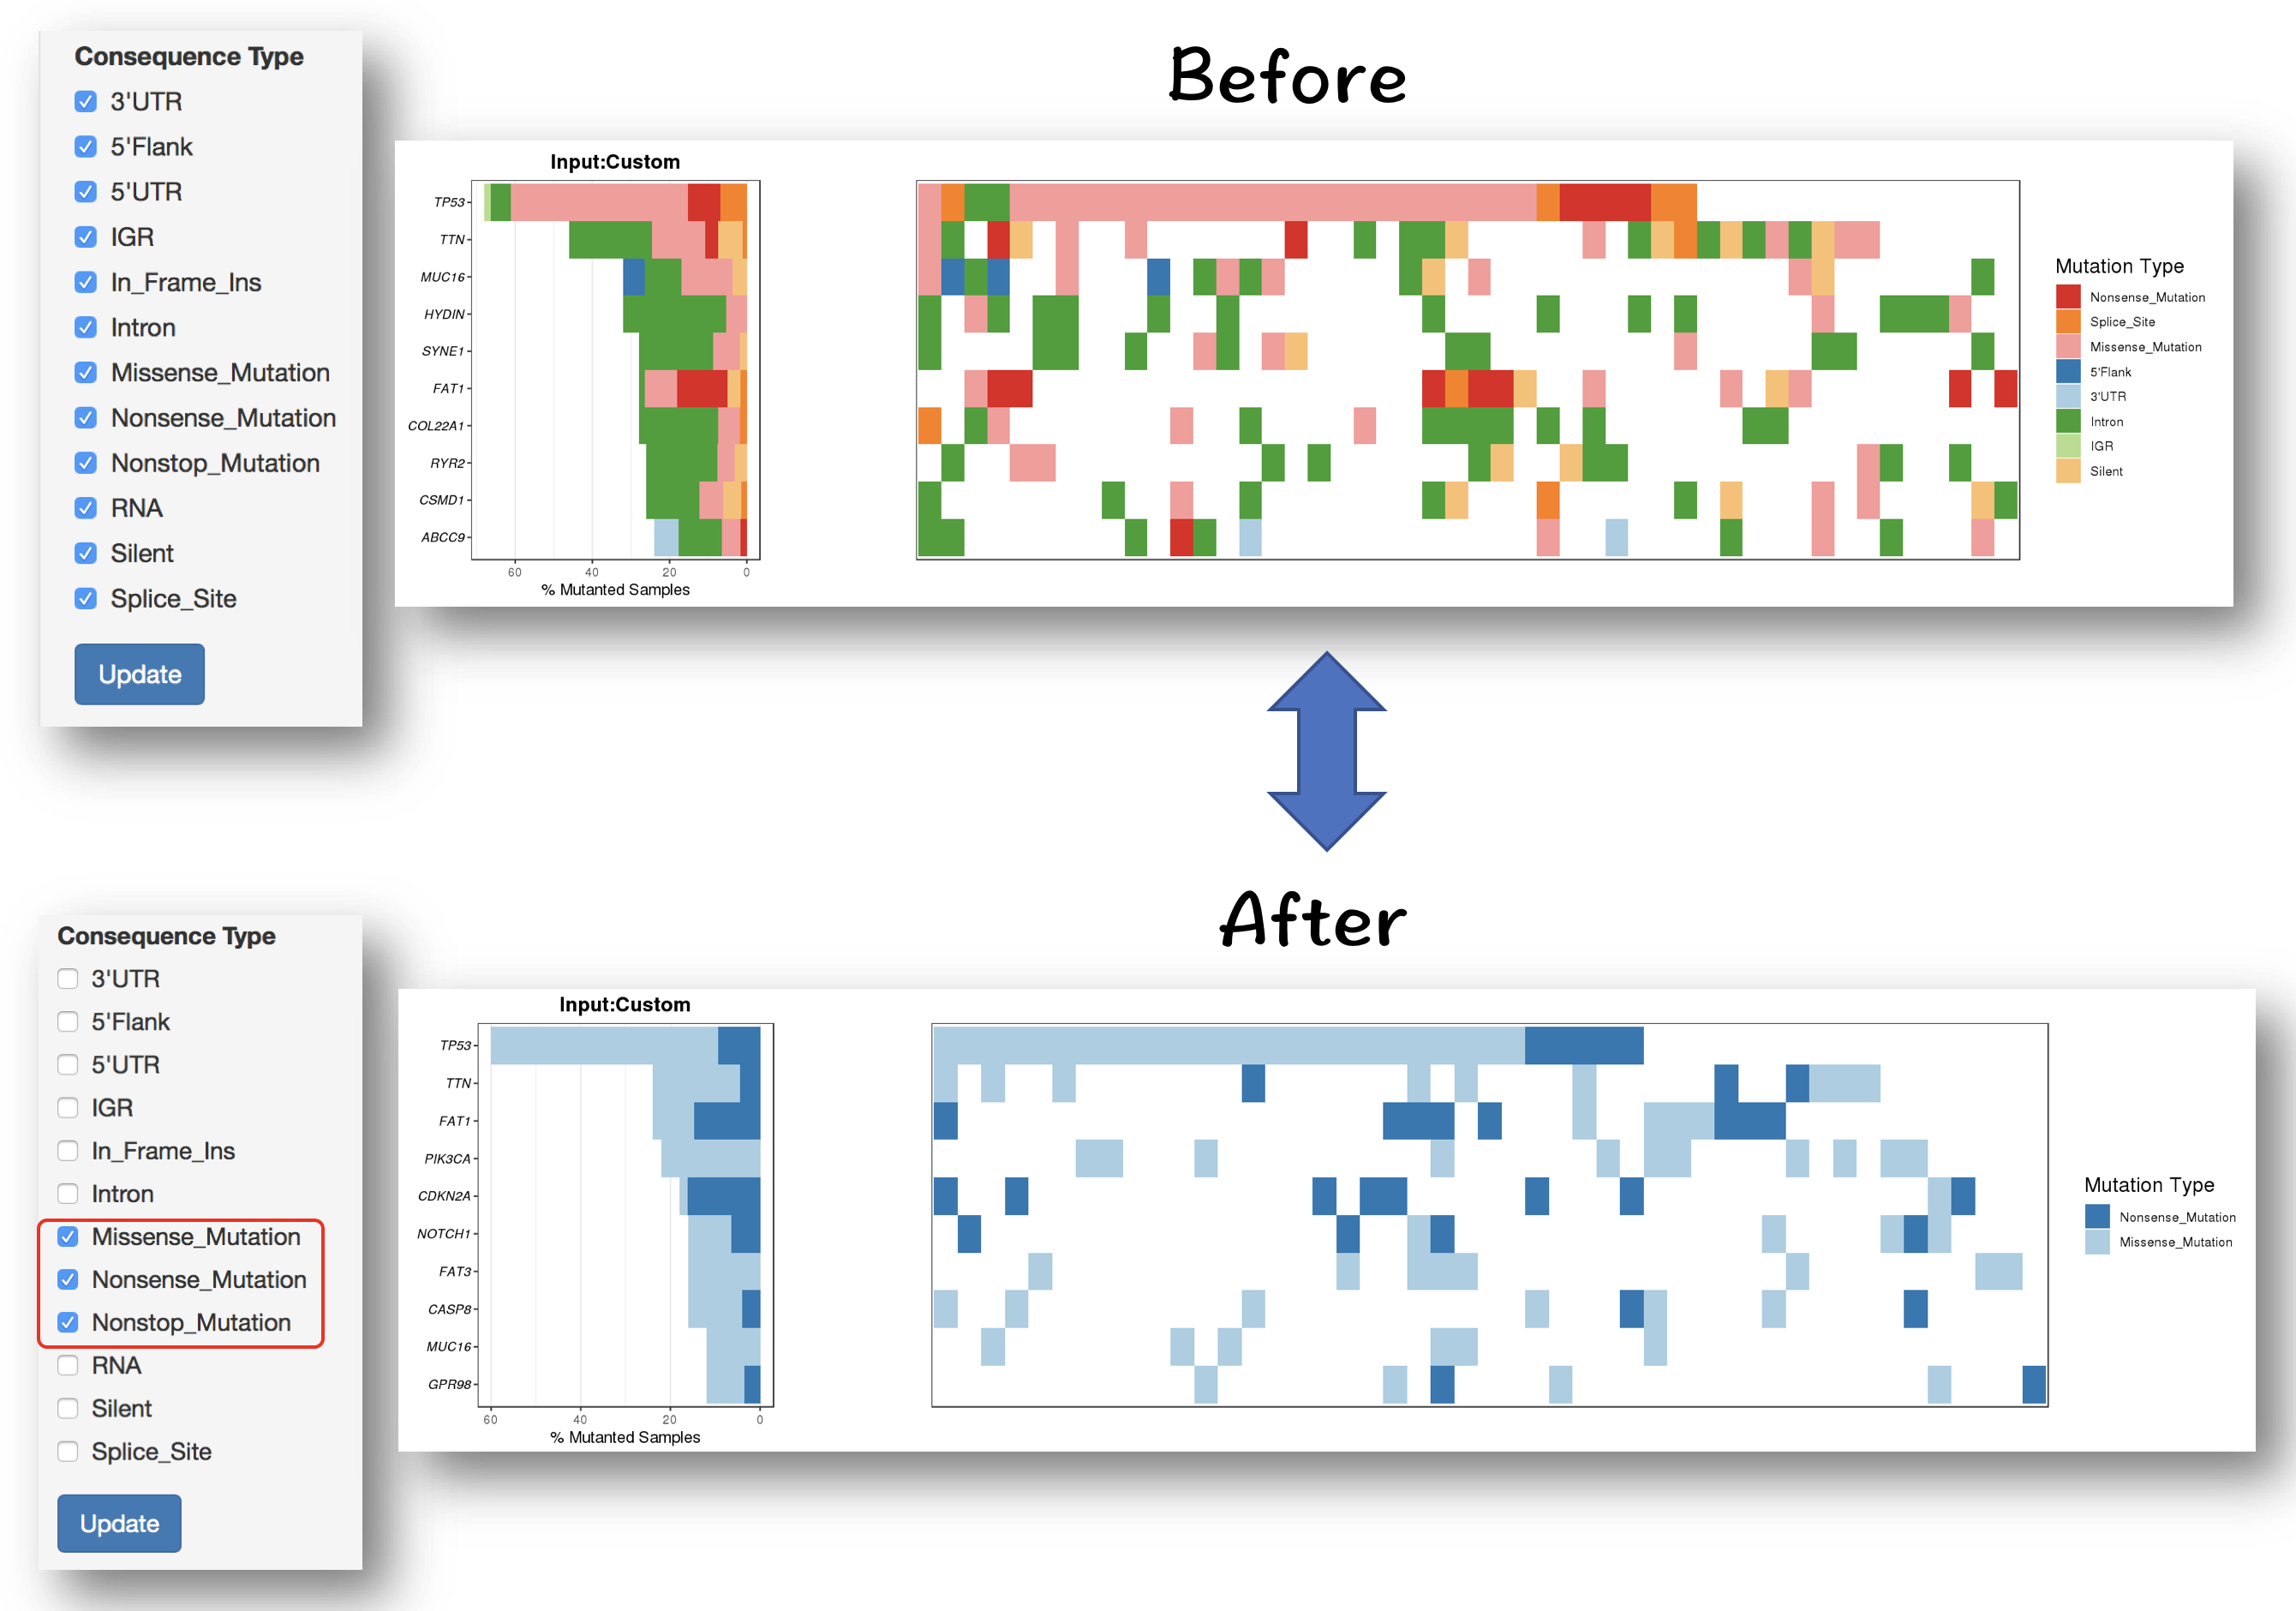
#### Filter for selecting specific mutation types
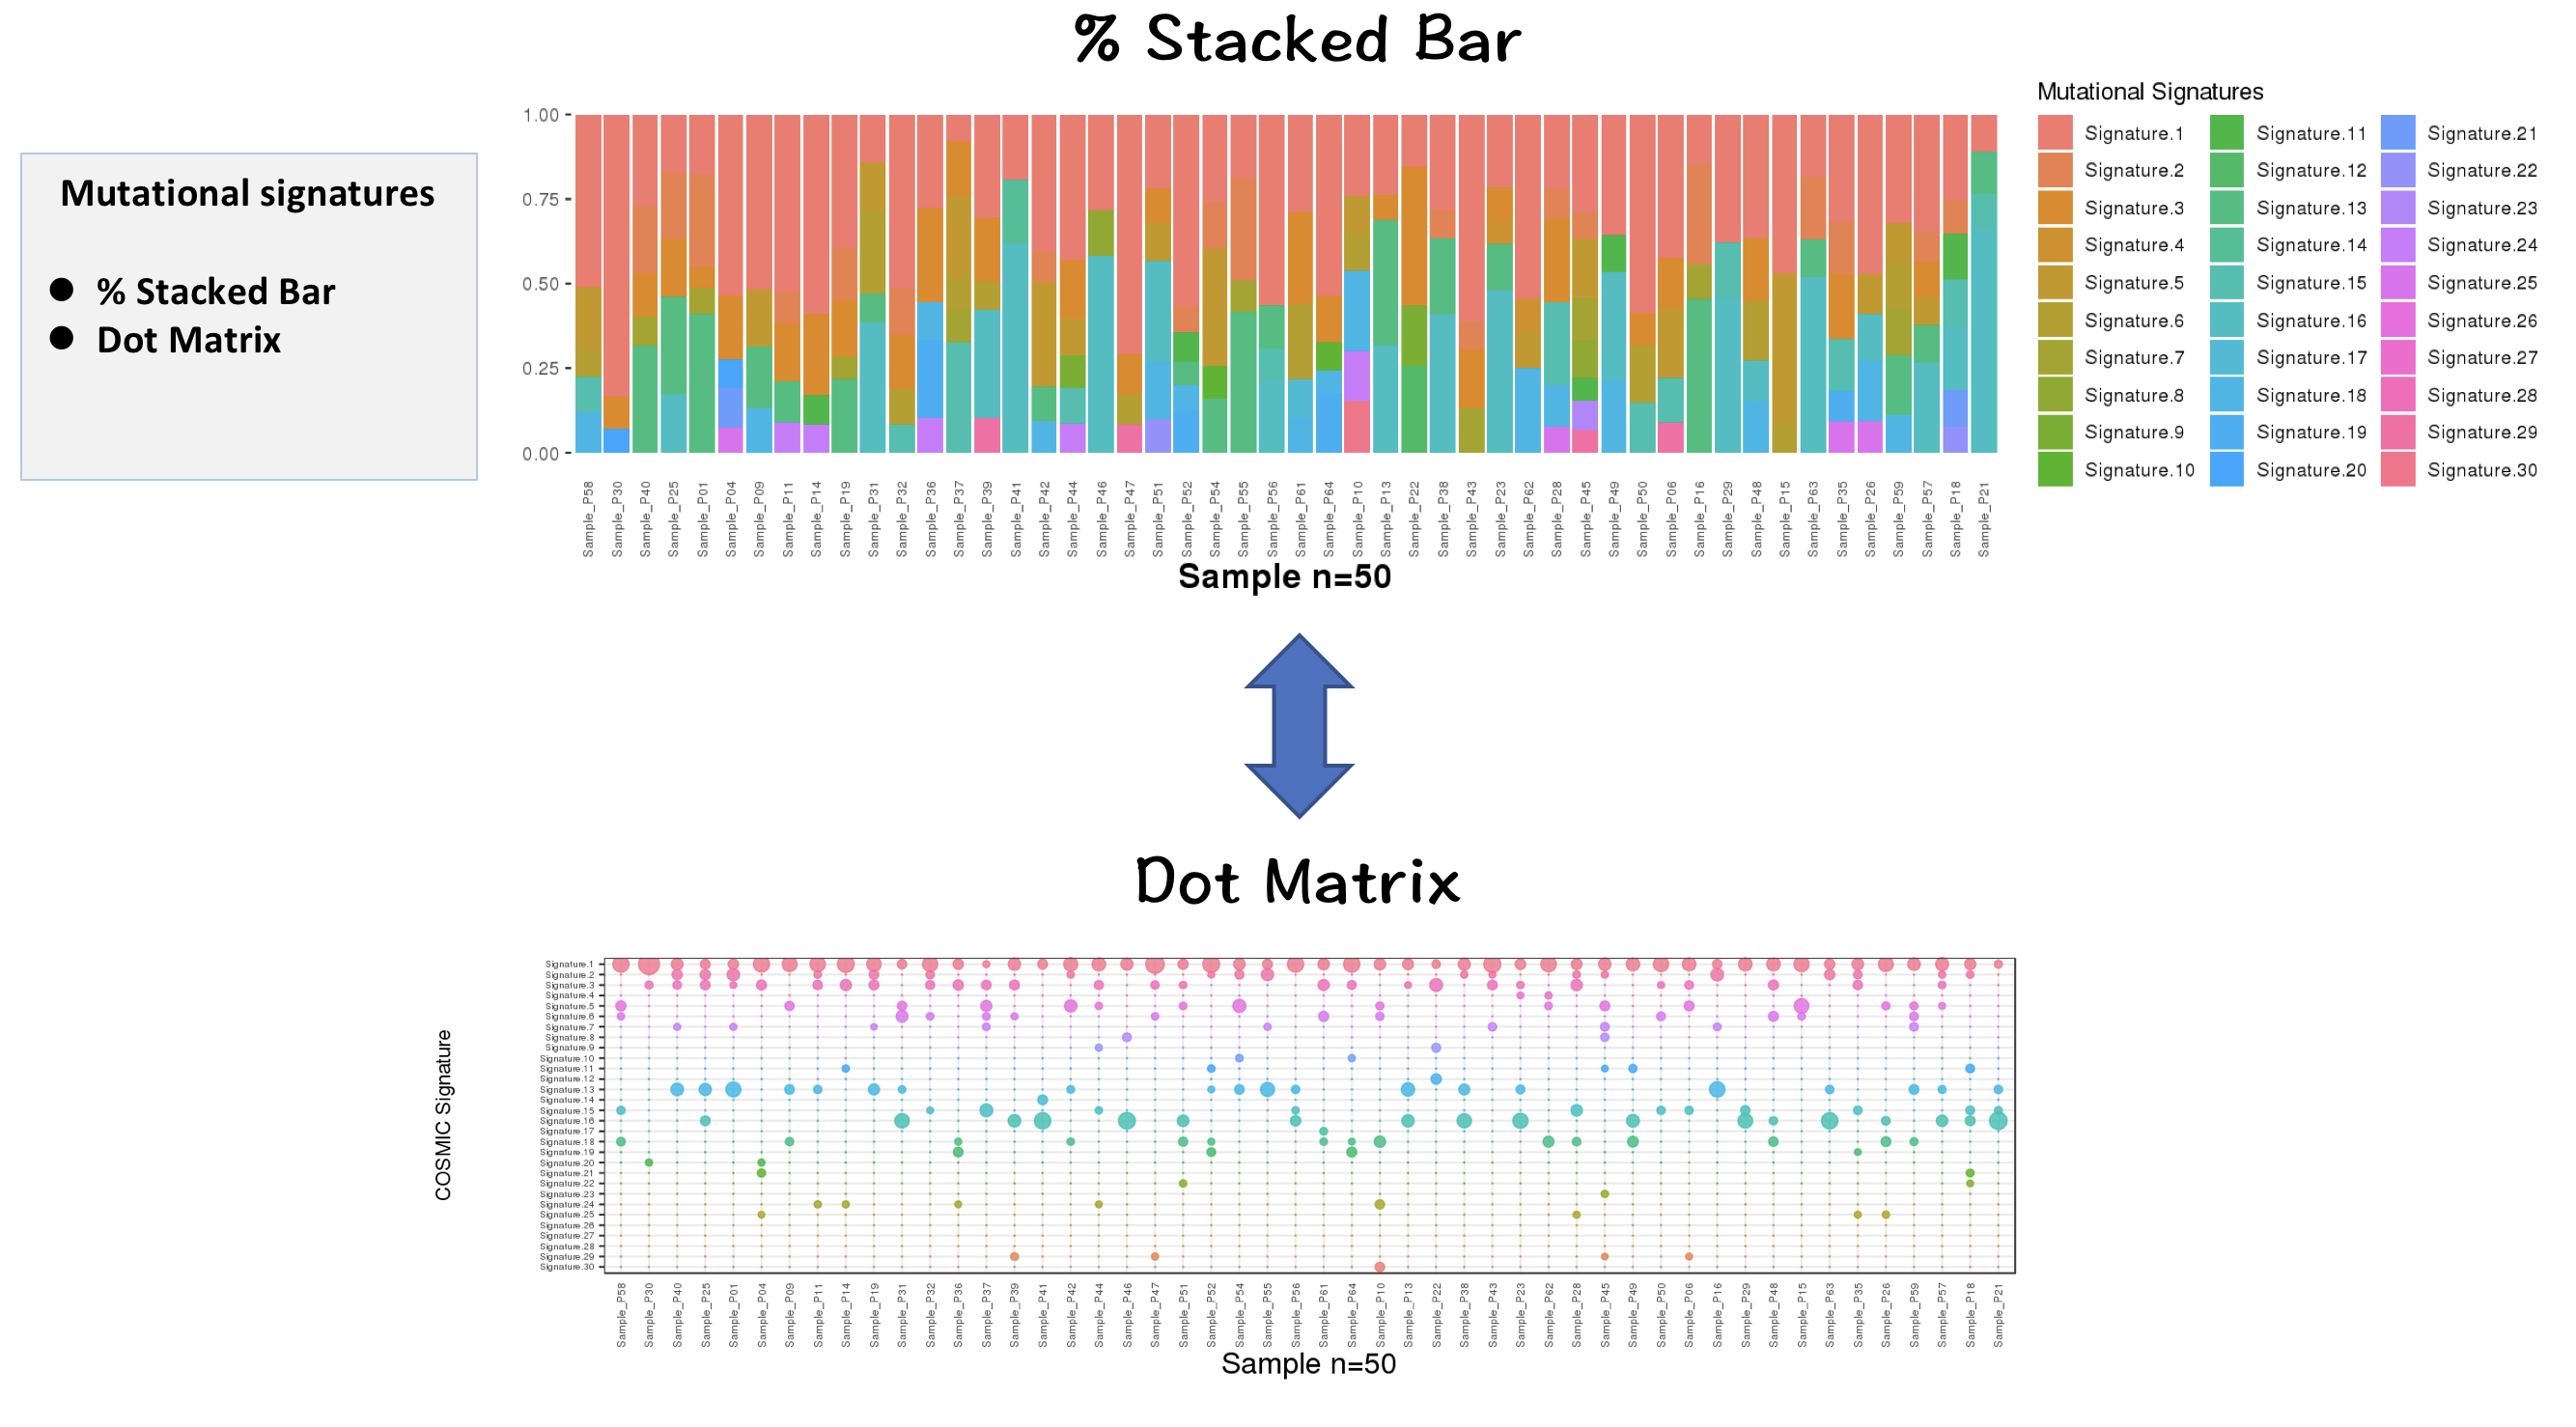
3.2.2.2 Inspecting contributions of mutational signatures in individual samples
Contributions of known mutational signatures (https://cancer.sanger.ac.uk/cosmic/signatures) in individual samples were quantified by using deconstructSigs packages.
Percentage stacked bar is a commonly used method for displaying the contributions of mutational signatures in each sample. However, users may find it very difficult to distinguish signatures from each other when too many signatures were identified in a sample.
To address this issue, we provide an alternative way to display the contributions of mutational signatures using dot matrix. As shown in the following figure, users can easily depict the landscape of mutational signatures across samples using dot matrix.
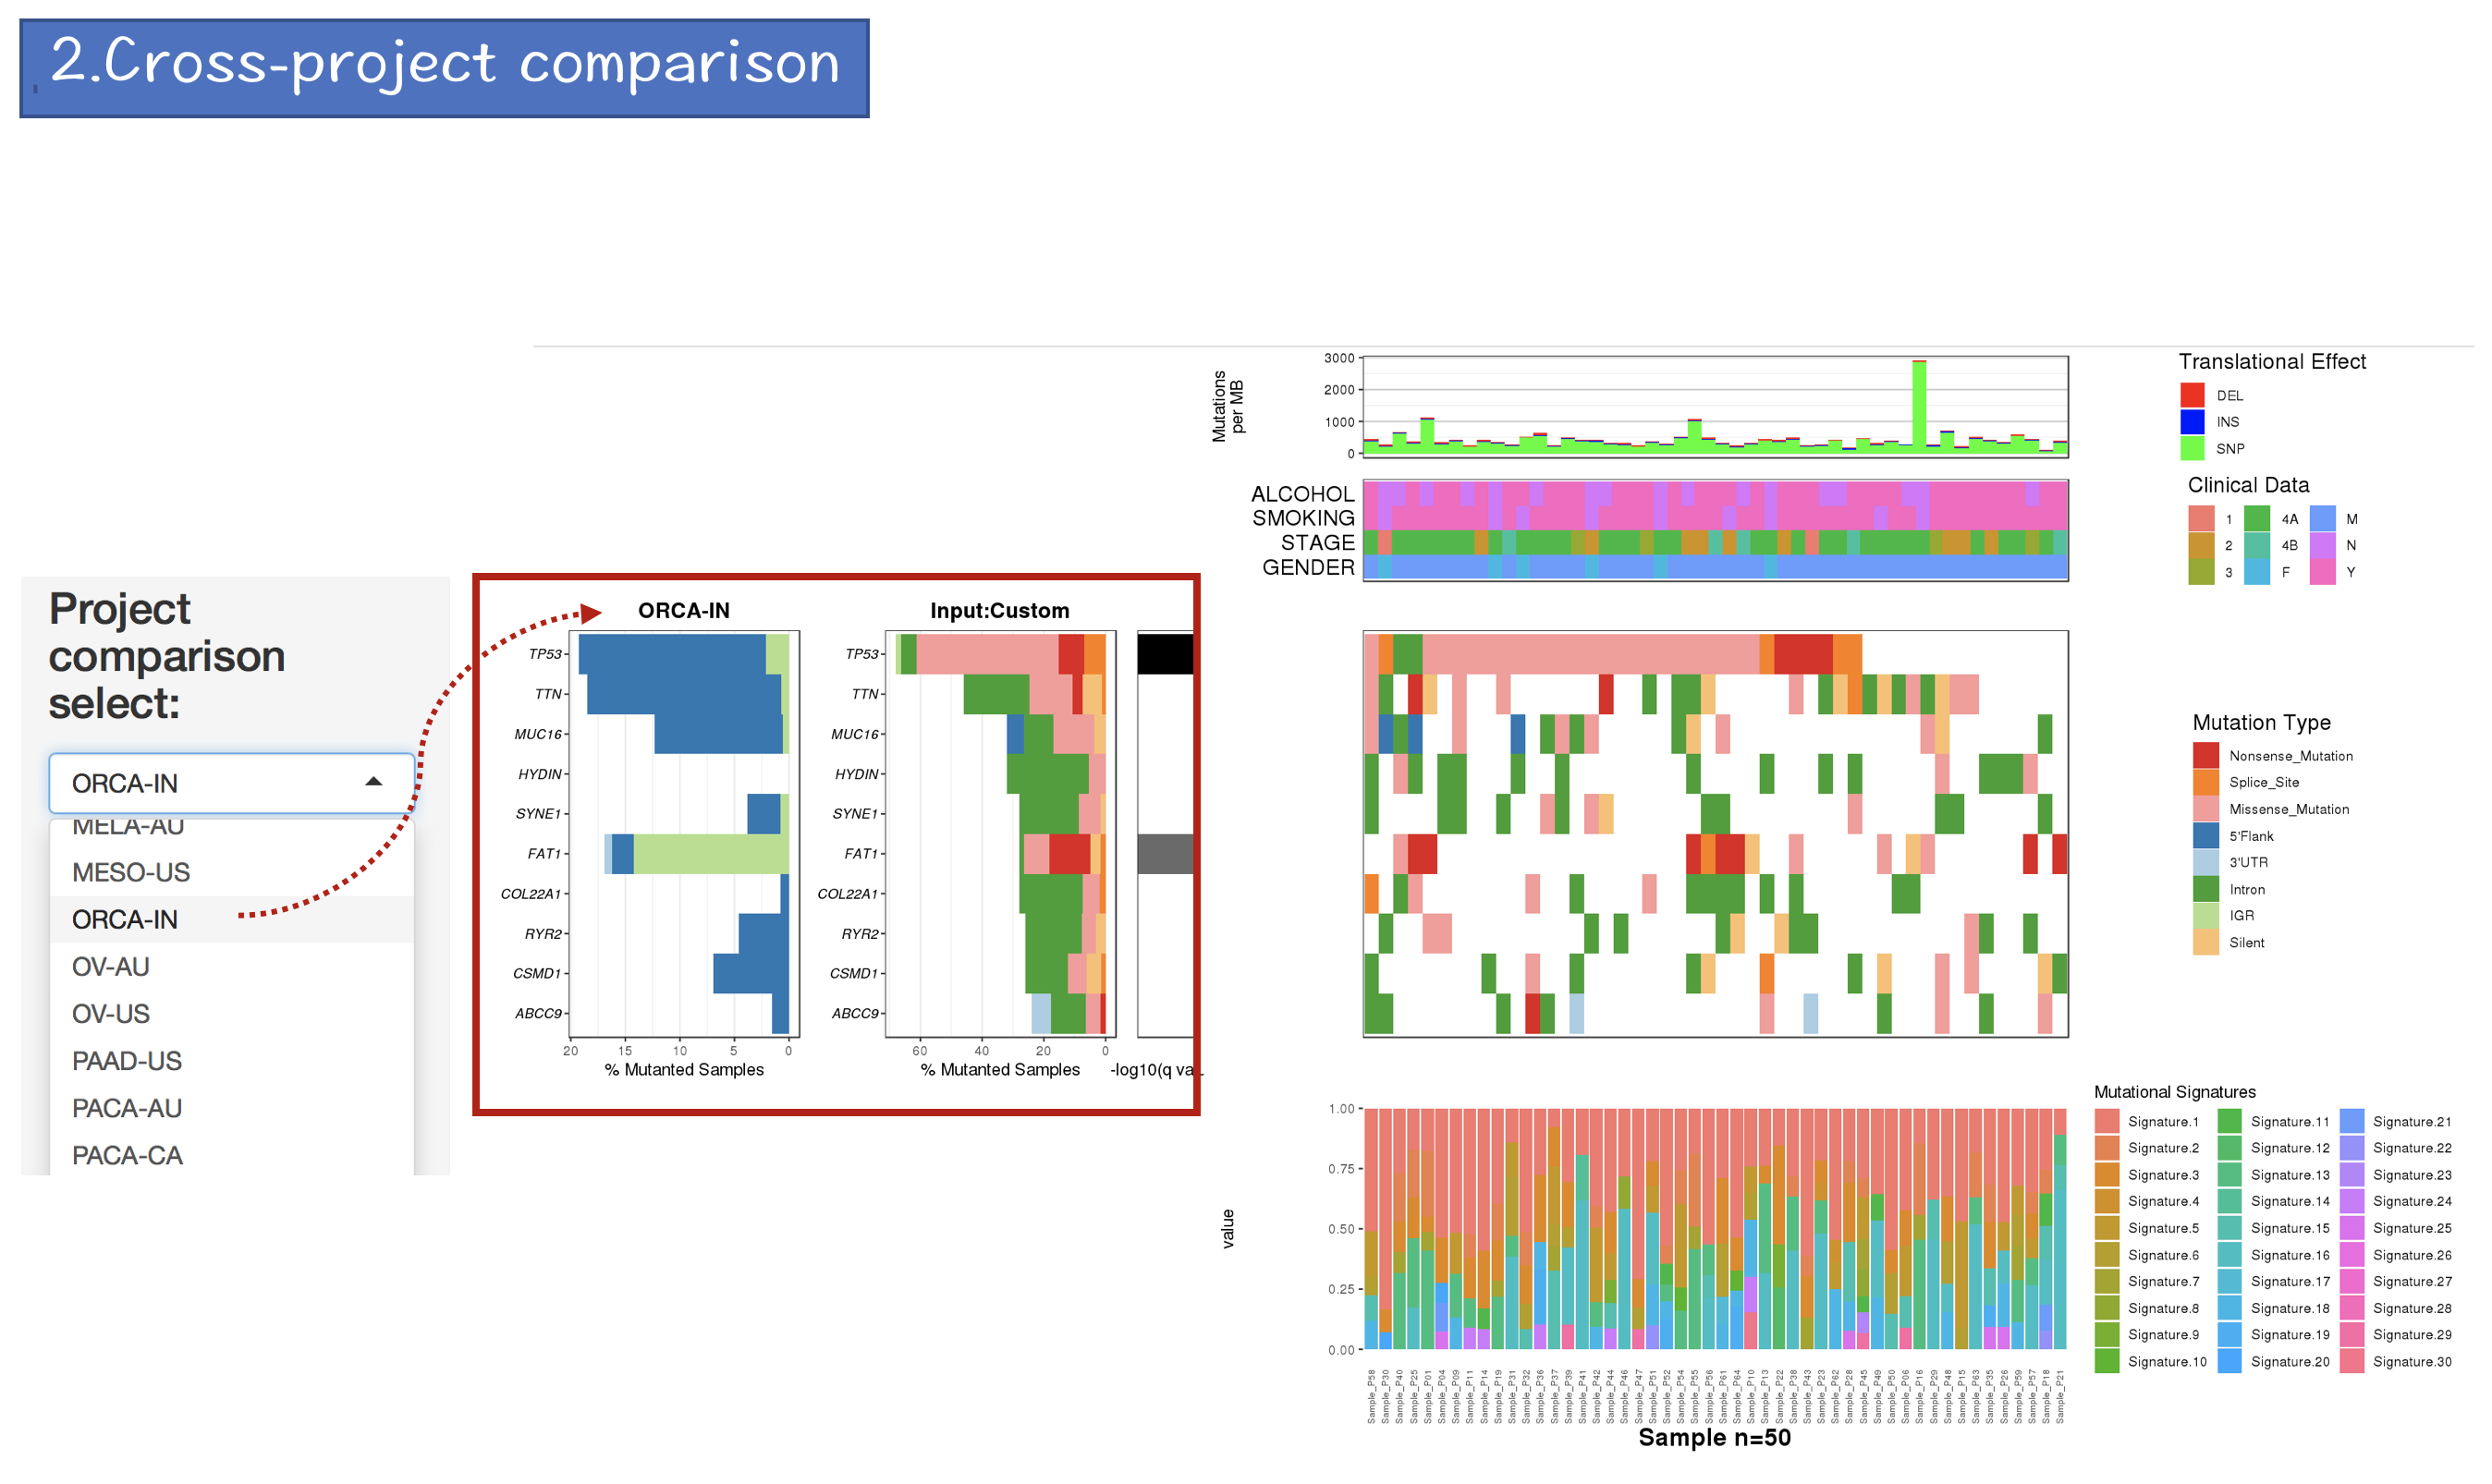
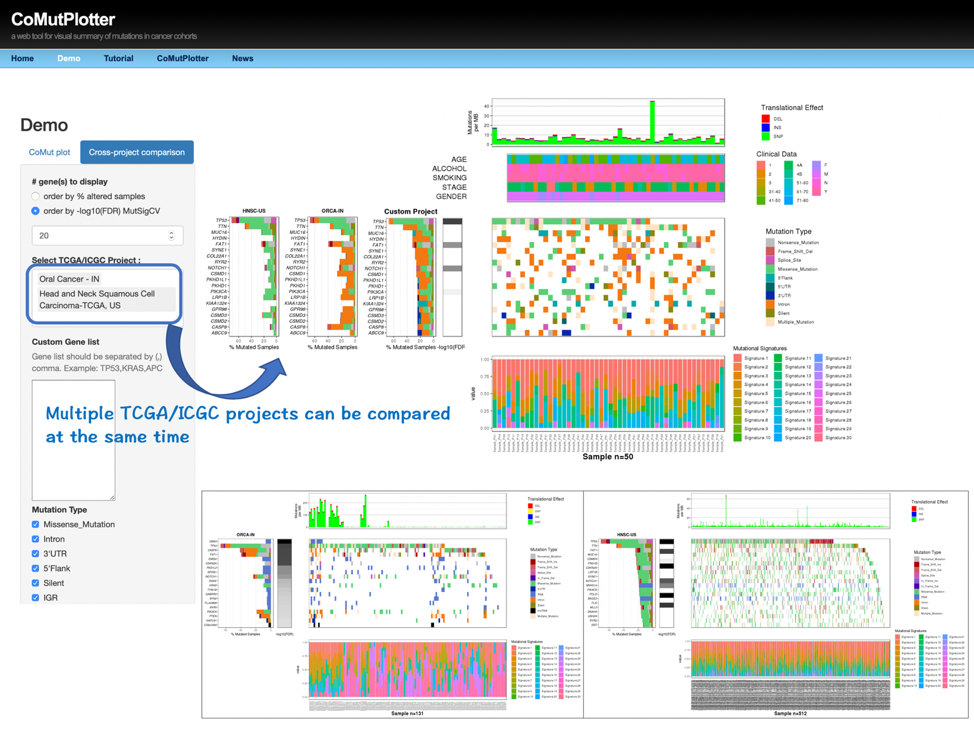
3.3 Cross-project comparison
3.4 Download & Report Generation